pi-prometheus
See what your Pi session actually costs: a per-source context breakdown in the terminal showing which extension, skill or MCP server eats your window, plus a /metrics endpoint and Grafana dashboards.
Package details
Install pi-prometheus from npm and Pi will load the resources declared by the package manifest.
$ pi install npm:pi-prometheus- Package
pi-prometheus- Version
0.2.0- Published
- Aug 26, 2026
- Downloads
- 229/mo · 196/wk
- Author
- aramz33
- License
- MIT
- Types
- extension
- Size
- 412 KB
- Dependencies
- 0 dependencies · 1 peer
Pi manifest JSON
{
  "extensions": [
    "./extensions/prometheus/index.ts"
  ],
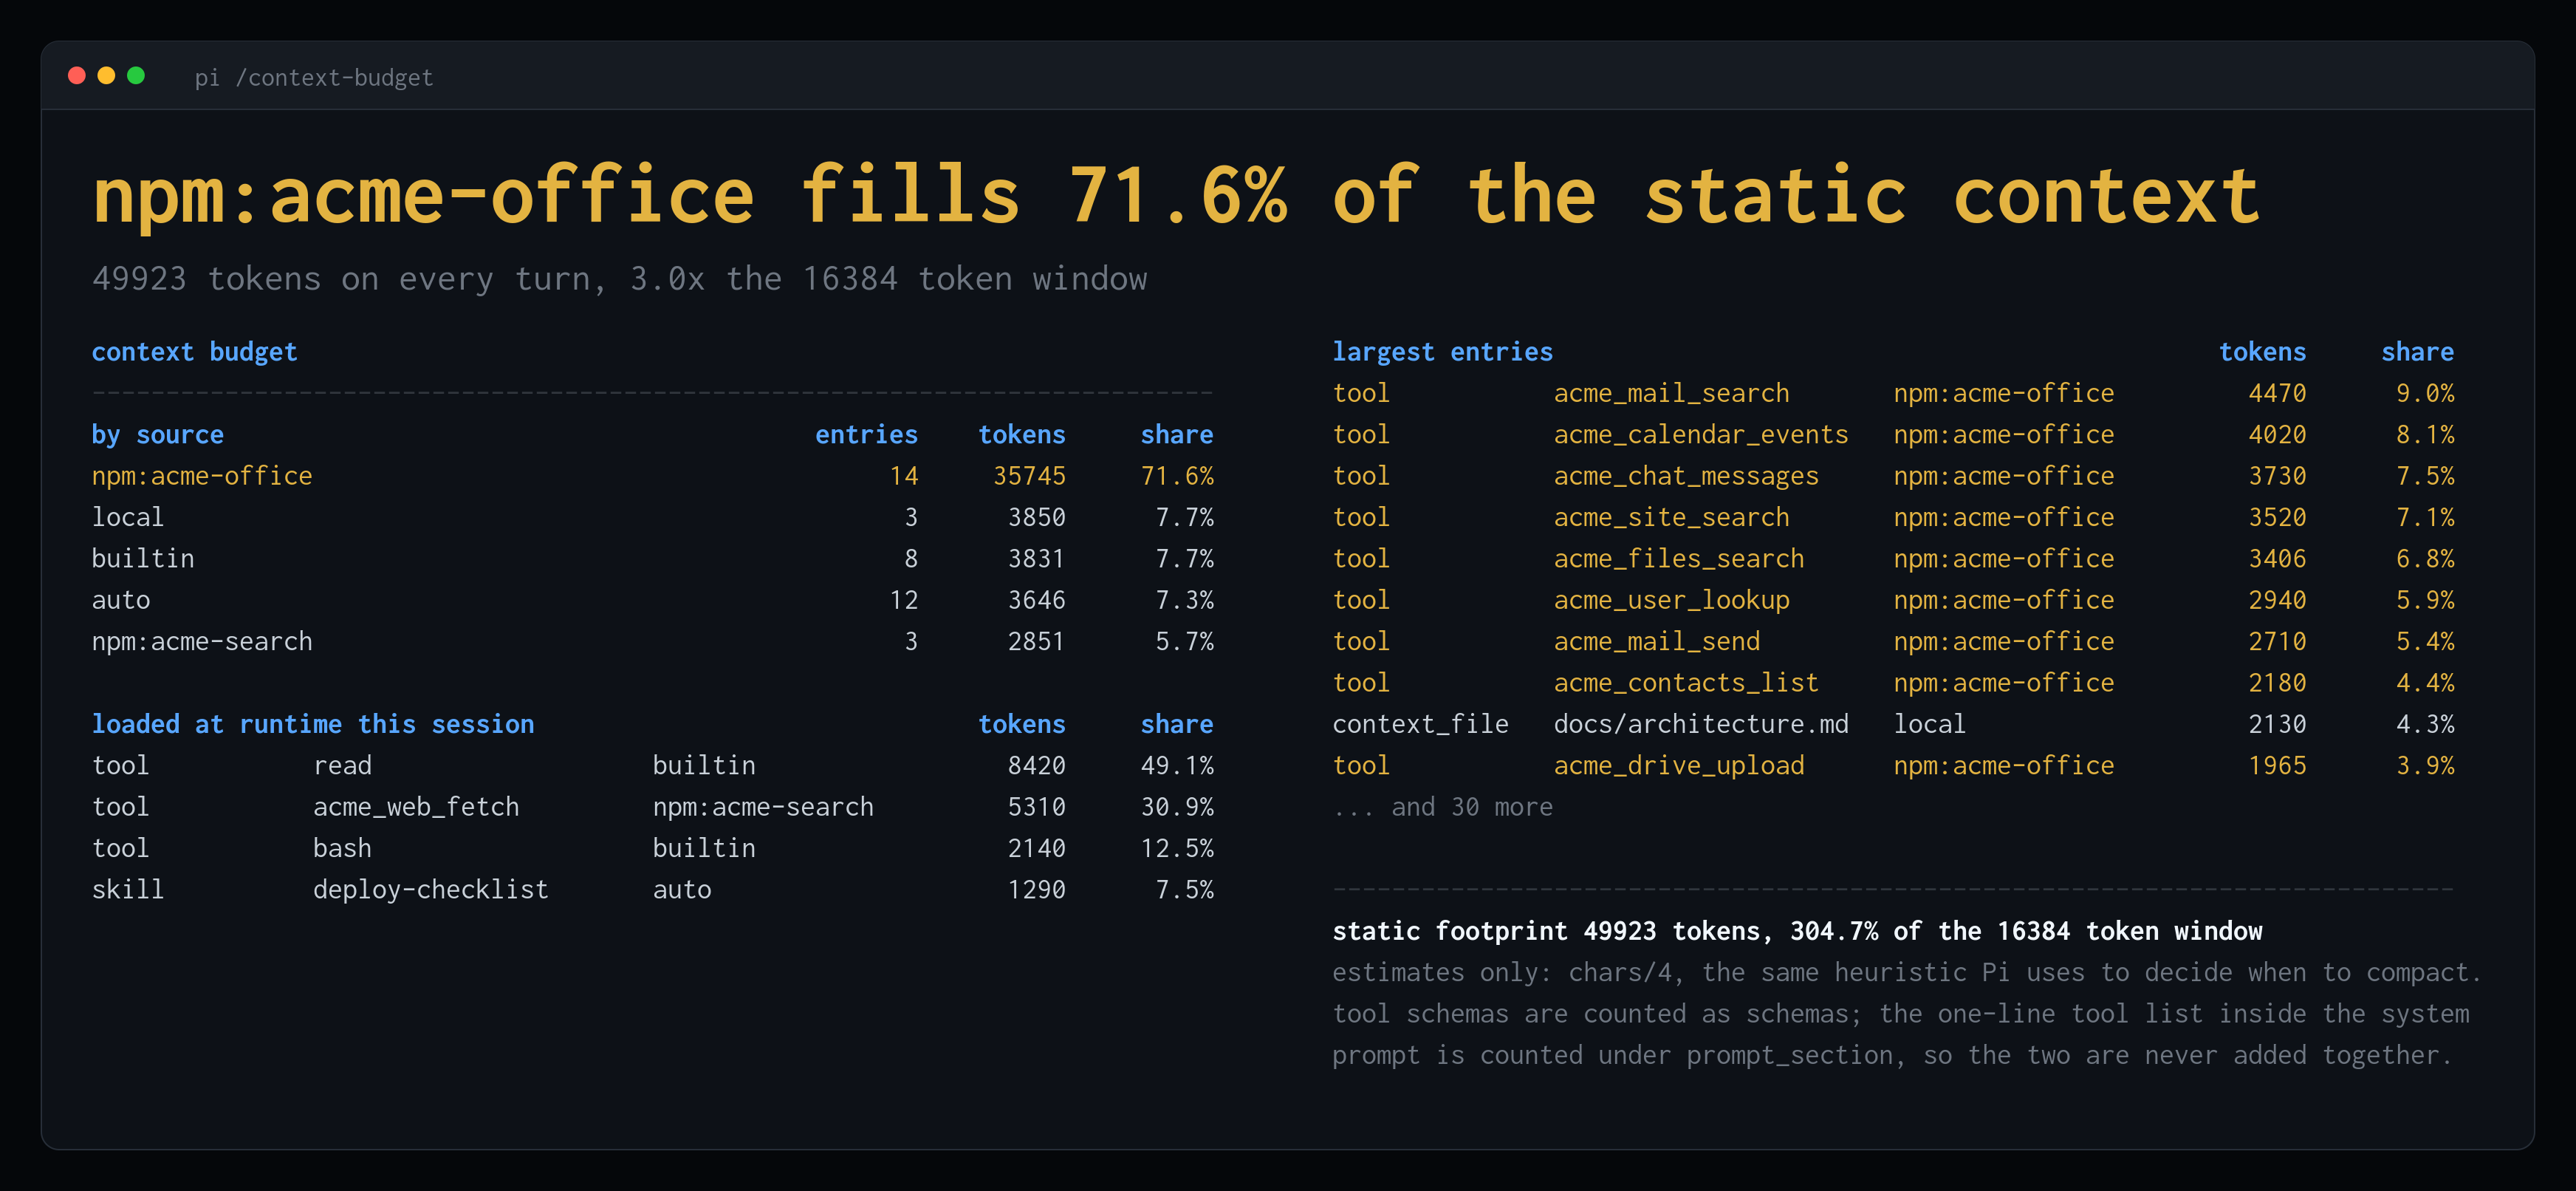
  "image": "https://raw.githubusercontent.com/aramz33/pi-prometheus/v0.2.0/examples/media/context-budget.png"
}
Security note
Pi packages can execute code and influence agent behavior. Review the source before installing third-party packages.
README
pi-prometheus
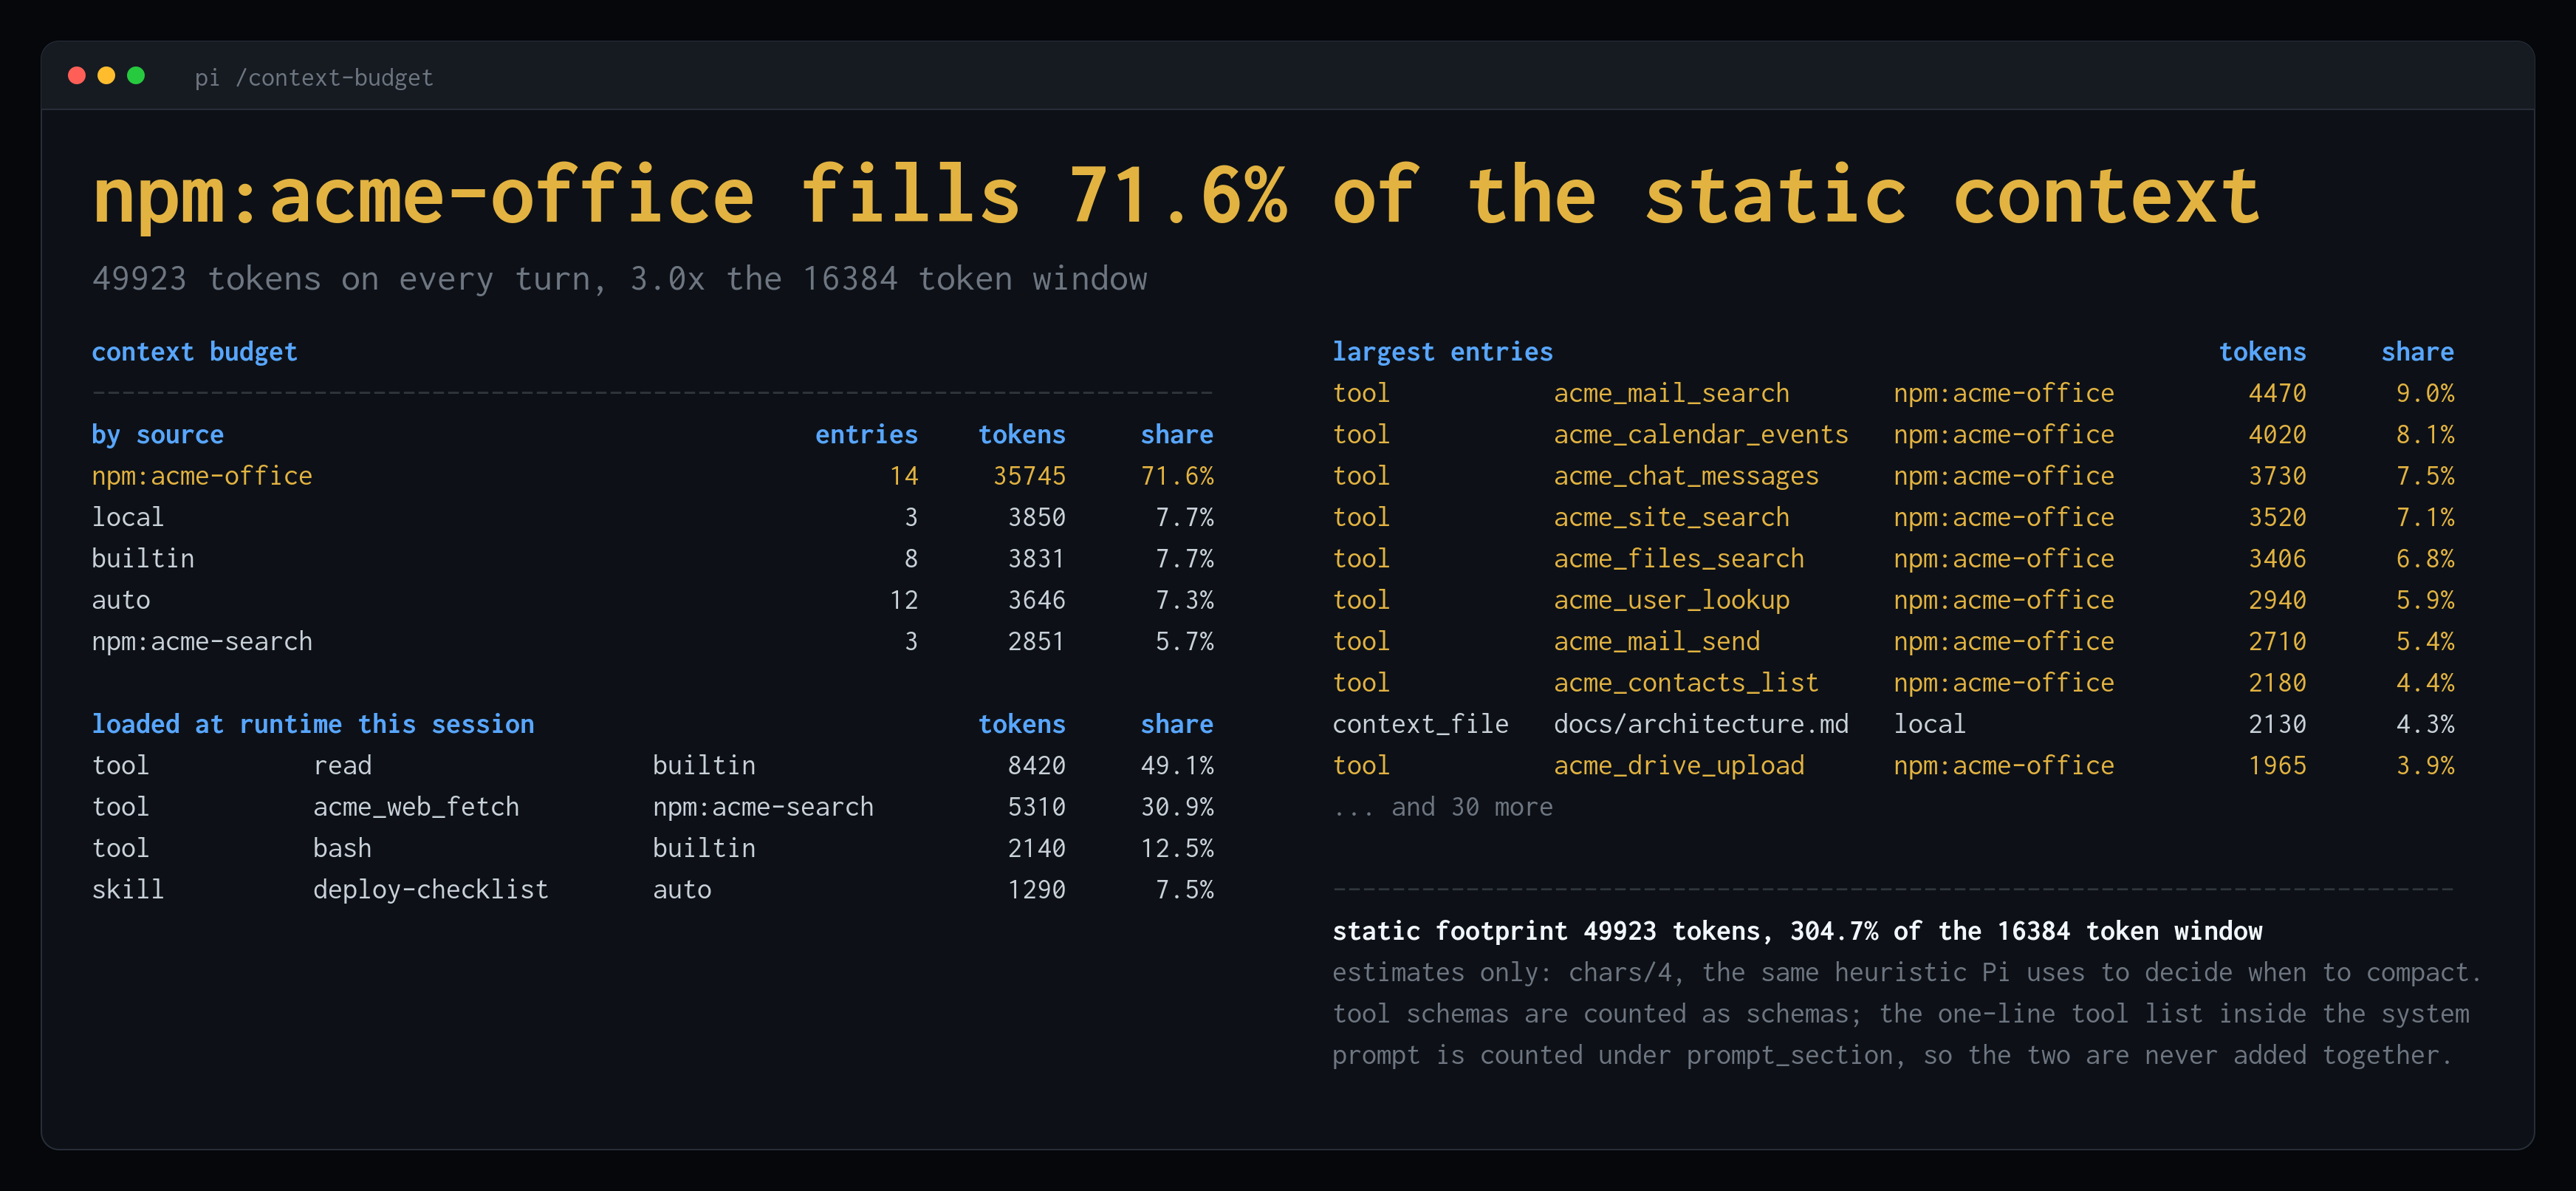
Shows which extension, skill, MCP server or context file is eating your context window,
and exposes every session number on a Prometheus /metrics endpoint.
Install
pi install npm:pi-prometheus
Works without Prometheus
No scraper, no config, no daemon. Two commands inside the session.
/context-budget
What a session pays on every request, before you type a word, attributed to the thing that caused it:
context budget
----------------------------------------------------------------------------
by source                                        entries    tokens     share
npm:acme-office                                       14     35745     71.6%
local                                                  3      3850      7.7%
builtin                                                8      3831      7.7%
auto                                                  12      3646      7.3%
npm:acme-search                                        3      2851      5.7%

largest entries                                             tokens     share
tool           acme_mail_search       npm:acme-office         4470      9.0%
tool           acme_calendar_events   npm:acme-office         4020      8.1%
tool           acme_chat_messages     npm:acme-office         3730      7.5%
tool           acme_site_search       npm:acme-office         3520      7.1%
tool           acme_files_search      npm:acme-office         3406      6.8%
tool           acme_user_lookup       npm:acme-office         2940      5.9%
tool           acme_mail_send         npm:acme-office         2710      5.4%
tool           acme_contacts_list     npm:acme-office         2180      4.4%
context_file   docs/architecture.md   local                   2130      4.3%
tool           acme_drive_upload      npm:acme-office         1965      3.9%
... and 30 more

loaded at runtime this session                              tokens     share
tool           read                   builtin                 8420     49.1%
tool           acme_web_fetch         npm:acme-search         5310     30.9%
tool           bash                   builtin                 2140     12.5%
skill          deploy-checklist       auto                    1290      7.5%

----------------------------------------------------------------------------
static footprint 49923 tokens, 304.7% of the 16384 token window
estimates only: chars/4, the same heuristic Pi uses to decide when to compact.
tool schemas are counted as schemas; the one-line tool list inside the system
prompt is counted under prompt_section, so the two are never added together.
kind is a closed set of four: tool (a tool's JSON schema), skill (its entry in the
skills block), context_file (a file Pi injects, AGENTS.md and friends), and
prompt_section (Pi's own instructions, the one-line tool list included).
source is where the thing came from. builtin is Pi itself, npm:<package>,
git:<repo> and local are the three ways a package can be installed, and auto is
anything Pi discovered by convention rather than through a package: a skill sitting in
~/.pi/agent/skills or in a project's .pi/skills (dist/core/package-manager.js:1941).
auto is a real limit, not a category. A skill dropped into one of those directories
by hand carries no package identity anywhere in Pi, so this exporter has none to report.
On a machine where most skills arrived that way the by-source table collapses into a
single large auto bucket. Measured on a real session: auto was 97 percent of a 49923
token static footprint, 48506 tokens of skills against 1417 of builtin, with a 16384
token window. Three times the window, before a word was typed. The
largest-entries table still names every skill and its cost individually, so the
information is not lost, it moves out of the by-source view.
The second table is what the session read in afterwards: tool results, and reads that landed inside a skill's directory, which is the half of a skill that progressive disclosure keeps out of the system prompt.
/metrics
The session's own numbers, and where to scrape them:
pi-prometheus
----------------------------------------------------------------------------
endpoint                http://127.0.0.1:54321/metrics
targets dir             /Users/you/.pi/metrics/targets
session                 01K3Q7M2X4E8VBN0T5RHJC9WYD
model                   anthropic/claude-sonnet-4-6

input tokens                   18422
output tokens                   3117
cache read tokens             210488
cache write tokens             49923
cost usd                      0.7413
turns                             14
static footprint               49923
attribution             full, top 100
The endpoint is live from session start, so curl works with no Prometheus anywhere.
Status line
PI_PROMETHEUS_STATUS controls the entry in Pi's status line:
| Value | Shows |
|---|---|
off |
nothing |
port (default) |
metrics :54321 |
full |
ctx 62% $0.74 :54321 |
Refreshed on message end and on compaction, never on the token stream.
Add Prometheus
Every session binds /metrics on an ephemeral loopback port and writes a target file to
~/.pi/metrics/targets/<pid>.json. Point a scraper at that directory once and every
session, 1 or 10 in parallel, is discovered and dropped automatically.
scrape_configs:
  - job_name: pi
    scrape_interval: 15s
    file_sd_configs:
      - files: ["/Users/<you>/.pi/metrics/targets/*.json"]
        refresh_interval: 15s
Full example: examples/prometheus-scrape.yml.
VictoriaMetrics takes the same file via -promscrape.config
(examples/victoriametrics-scrape.yml).
Grafana Mimir and anything else that scrapes the Prometheus text format work too.
session_id, cwd and pid arrive as target labels from service discovery, so every
series is attributable to its session without the exporter emitting those labels itself.
The whole stack in one command
# edit the pi-targets bind mount first: Compose does not expand ~
docker compose -f examples/docker-compose.yml up -d
pi
Prometheus on 127.0.0.1:9090, Grafana on 127.0.0.1:3000, both dashboards provisioned
in a folder named Pi, filled within a minute. See
examples/docker-compose.yml for the Linux note.
Dashboards
examples/grafana-dashboard.json, "Pi coding agent": sessions online, cost, context usage, token rate, tool calls and errors, turn duration percentiles, filterable per session.examples/grafana-dashboard-attribution.json, "Pi context attribution": context tax by package, largest entries, tokens before you type, static footprint over time, runtime ingestion by source.
Metrics
| Metric | Type | Labels | Meaning |
|---|---|---|---|
pi_session_info |
gauge | model, cwd, session_id |
Static session info (always 1) |
pi_prometheus_build_info |
gauge | version, pi_version |
Exporter version and the Pi it runs in (always 1) |
pi_session_start_time_seconds |
gauge | Unix time the session started | |
pi_tokens_total |
counter | type = input | output | cache_read | cache_write |
Tokens consumed |
pi_cost_usd_total |
counter | Cumulative cost (provider cost model) | |
pi_turns_total |
counter | Agent turns completed | |
pi_tool_calls_total |
counter | tool |
Tool executions |
pi_tool_errors_total |
counter | tool |
Tool executions that errored |
pi_compactions_total |
counter | reason |
Context compactions |
pi_compaction_failures_total |
counter | reason |
Compactions that failed or were aborted |
pi_context_static_tokens |
gauge | Estimated tokens the system prompt and tool schemas cost on every turn | |
pi_context_footprint_tokens |
gauge | kind, name, source |
The same total, split by what caused it |
pi_source_tokens_total |
counter | kind, name, source |
Tokens ingested at runtime, by source |
pi_tool_nested_tokens_total |
counter | tool, type |
Sub-agent tokens spent inside a tool, when the tool reports usage |
pi_tool_nested_cost_usd_total |
counter | tool |
Cost in USD of that sub-agent work |
pi_context_tokens |
gauge | Estimated tokens currently in context | |
pi_context_window_tokens |
gauge | Context window of the active model | |
pi_turn_duration_seconds |
histogram | le |
Turn duration (buckets 5s to 600s, sized for local models) |
The two families carrying kind, name and source are the ones
PI_PROMETHEUS_ATTRIBUTION gates. pi_context_static_tokens is emitted whatever the
attribution and cardinality settings say, and stays the true total.
Useful queries:
# which package costs the most, per session
sum by (source) (pi_context_footprint_tokens)

# what a package costs as a share of the window
sum by (instance, source) (pi_context_footprint_tokens)
  / on (instance) group_left pi_context_window_tokens

# what got read in during the session, by package
sum by (source) (rate(pi_source_tokens_total[$__rate_interval]))
How attribution works, and what it does not claim
The numbers are estimates, and they are Pi's own estimates. Token counts are
chars/4, the same heuristic Pi uses to decide when to compact
(dist/core/compaction/compaction.js:188, Pi 0.84.3). No tokenizer is involved, in this package or
in that decision. The consequence is the point: these numbers and Pi's own context gauge
agree by construction, so a footprint of 15 percent here is 15 percent of the same window
Pi is about to compact.
Tool schemas are over-estimated. JSON schemas tokenise denser than four characters per token, so a package that ships large schemas looks slightly more expensive than it is. The ranking between packages holds; the absolute number is an upper bound.
Cost per source is not attributable, and is not claimed. Billed tokens cover the
whole request, conversation history included, so there is no honest way to split a
dollar figure across the sources that filled the prompt. This package reports tokens and
footprints per source, and dollars only for the session as a whole
(pi_cost_usd_total) or for sub-agent work a tool reports itself
(pi_tool_nested_cost_usd_total).
A tool is counted twice, under two different kinds, and never summed. Once as its
full JSON schema, measured against the tool definitions, under kind="tool". Once as its
one-line entry inside the system prompt, measured against the real assembled prompt
string, under kind="prompt_section". The same rule applies to pi_source_tokens_total:
a read inside a skill's directory is credited to both kind="tool" and kind="skill".
Sum by kind, never across it.
Only tools Pi actually sent are counted. pi.getAllTools() returns configured tools,
not active ones, so the footprint intersects it with the active set before attributing.
Cardinality is capped, and the cap folds rather than drops. Past
PI_PROMETHEUS_ATTRIBUTION_TOP_N named series, the tail collapses into name="_other"
rows, one per kind and source. sum by (source) and sum by (kind) therefore stay
exact however hard the cap bites. Two more things worth knowing:
- The fold also applies to
pi_source_tokens_total, which is a counter. When an entry climbs into the visible set between two scrapes, the_otherseries it leaves drops, andrate()reads that decrease as a counter reset. SetPI_PROMETHEUS_ATTRIBUTION_TOP_Nabove your entry count, or querysum by (source), if that matters to you. before_agent_startonly fires when a prompt is submitted, so a session where nothing has been typed has no footprint yet./context-budgetcomputes it on demand in that case, which is why the command works on a session that has said nothing.
Configuration
| Env var | Default | Meaning |
|---|---|---|
PI_PROMETHEUS_DIR |
~/.pi/metrics/targets |
Directory for service-discovery target files |
PI_PROMETHEUS_ATTRIBUTION |
full |
off drops the two per-source families and keeps pi_context_static_tokens, rollup keeps source and kind and collapses name, full names everything |
PI_PROMETHEUS_ATTRIBUTION_TOP_N |
100 |
Named series kept before the tail folds into _other. Zero or less means no cap |
PI_PROMETHEUS_STATUS |
port |
Status line entry: off, port, full |
Alerting
examples/alerts.yml ships four rules, loaded by both the scrape
config and the Compose stack:
| Alert | Fires when |
|---|---|
PiContextFootprintHigh |
Static footprint is above 15 percent of the window for 10m |
PiSessionNearCompaction |
Context is above 85 percent of the window for 5m |
PiToolErrorRateHigh |
A tool fails more than one call in five over 15m, on at least five calls |
PiSpendRateHigh |
Spend rate stays above $5 per hour for 10m |
Every ratio divides by a positive-value matcher, so a session that has not reported yet
produces no series instead of NaN.
Notes
- The endpoint binds
127.0.0.1only. Nothing is exposed on the network. - Works in all Pi run modes. The reports render as custom entries in the TUI and are
printed through
notifyin--print, JSON and RPC modes, where a custom entry would be invisible. - Counters reset on
session_start, which covers startup,/new,resumeandfork. Before 0.2.0 they did not: Pi caches the extension module per working directory, so the totals of the previous session carried into the next one in the same directory. If your 0.1.0 graphs show a session's counters continuing across a/new, that is the bug, and the discontinuity you see after upgrading is the fix. SeeCHANGELOG.md. - A custom entry costs no context tokens, so watching your budget does not add to it.
Development
npm test # node test/check.ts
The self-check boots the extension against a fake ExtensionAPI and a hand-written
system prompt, fires the events Pi would fire, and asserts on /metrics output: counter
reset across sessions, both halves of Pi's module cache included; the target-file
lifecycle, stale and .tmp cleanup and the liveness decision table; attribution lines
against token counts computed independently of the code under test; the three
attribution modes and the top-N fold; a read credited to the skill that owns the path;
both commands and the status line; and a tool_result carrying no usage field.
npm run poster # regenerates examples/media/context-budget.png, needs Docker
Positioning
The only pull-based scrape endpoint in the Pi ecosystem. No collector, no OTLP endpoint, no push gateway to run: all 35 other Pi observability packages push.
License
MIT