@juancrg90/agent-loop-debugger
Real-time debugger for Pi agent lifecycle events — streams turns, messages, tools, and provider events to a local webapp.
Package details
Install @juancrg90/agent-loop-debugger from npm and Pi will load the resources declared by the package manifest.
$ pi install npm:@juancrg90/agent-loop-debugger- Package
@juancrg90/agent-loop-debugger- Version
0.4.1- Published
- Oct 8, 2026
- Downloads
- 485/mo · 485/wk
- Author
- juancrg90
- License
- MIT
- Types
- extension
- Size
- 582.4 KB
- Dependencies
- 0 dependencies · 2 peers
Pi manifest JSON
{
  "extensions": [
    "./index.ts"
  ]
}
Security note
Pi packages can execute code and influence agent behavior. Review the source before installing third-party packages.
README
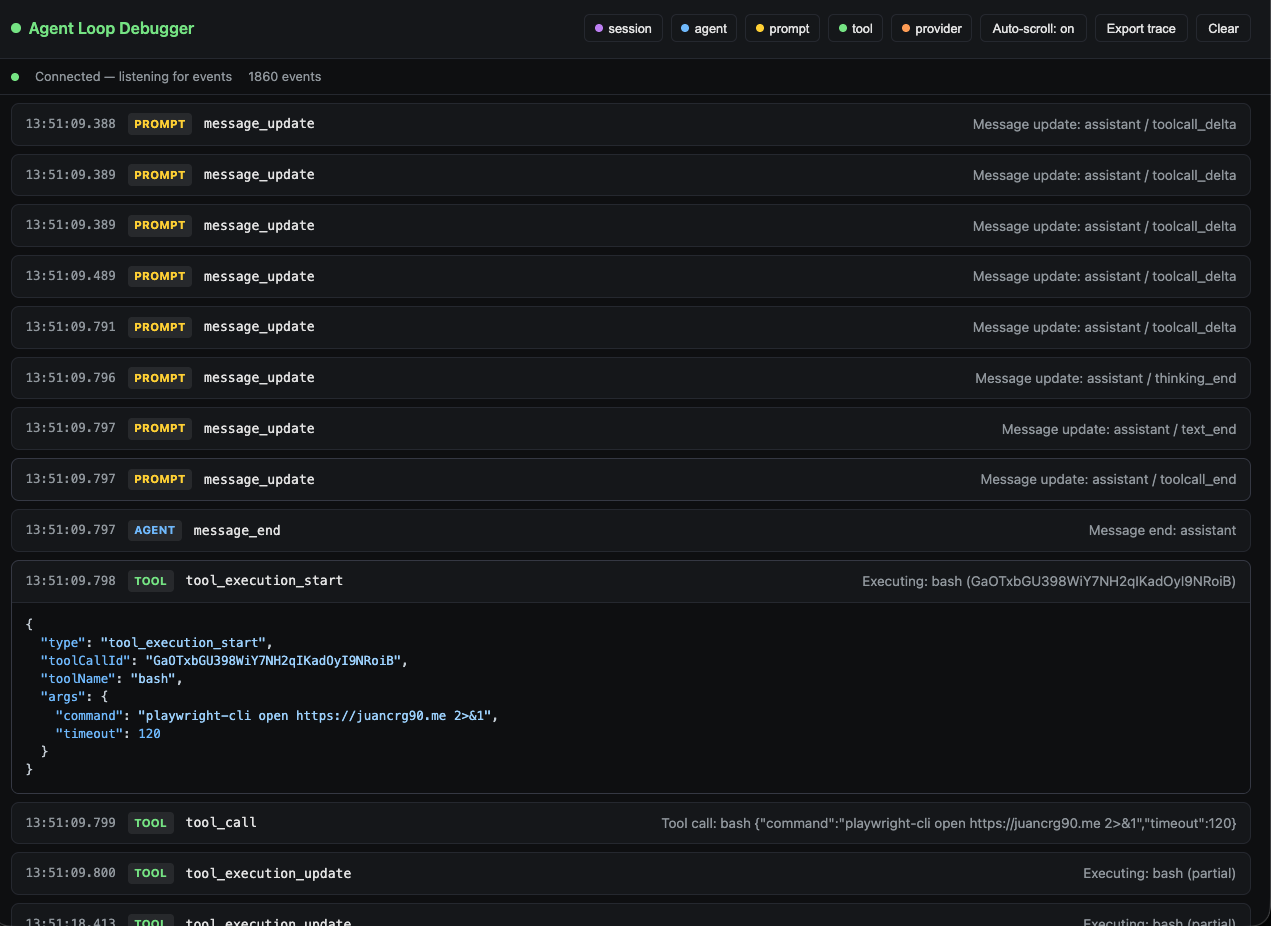
Agent Loop Debugger
A Pi extension that exposes a /agentloop command. Running it starts a small
local web server that serves a real-time debugger, streaming Pi agent lifecycle
events into a browser-based timeline.
Installation
pi install npm:@juancrg90/agent-loop-debuggerOr test locally:
pi -e ./packages/agent-loop-debuggerUsage
Inside Pi, run:
/agentloopThe command toggles the debugger server on and off. When started, it prints a
local URL such as http://127.0.0.1:54321. Open that URL in a browser to see
live events.
Commands
/agentloop— start or stop the debugger server./agentloop list— list saved trace files with index, timestamp, and event count./agentloop load <index|filename>— load a saved trace into the timeline./agentloop --herdr— show the current Herdr context (pane/tab/workspace IDs) if running under Herdr.
Traces are auto-saved to ~/.pi/agent/agent-loop-debugger/traces/ on every
session_shutdown and when the server stops.
Webapp controls
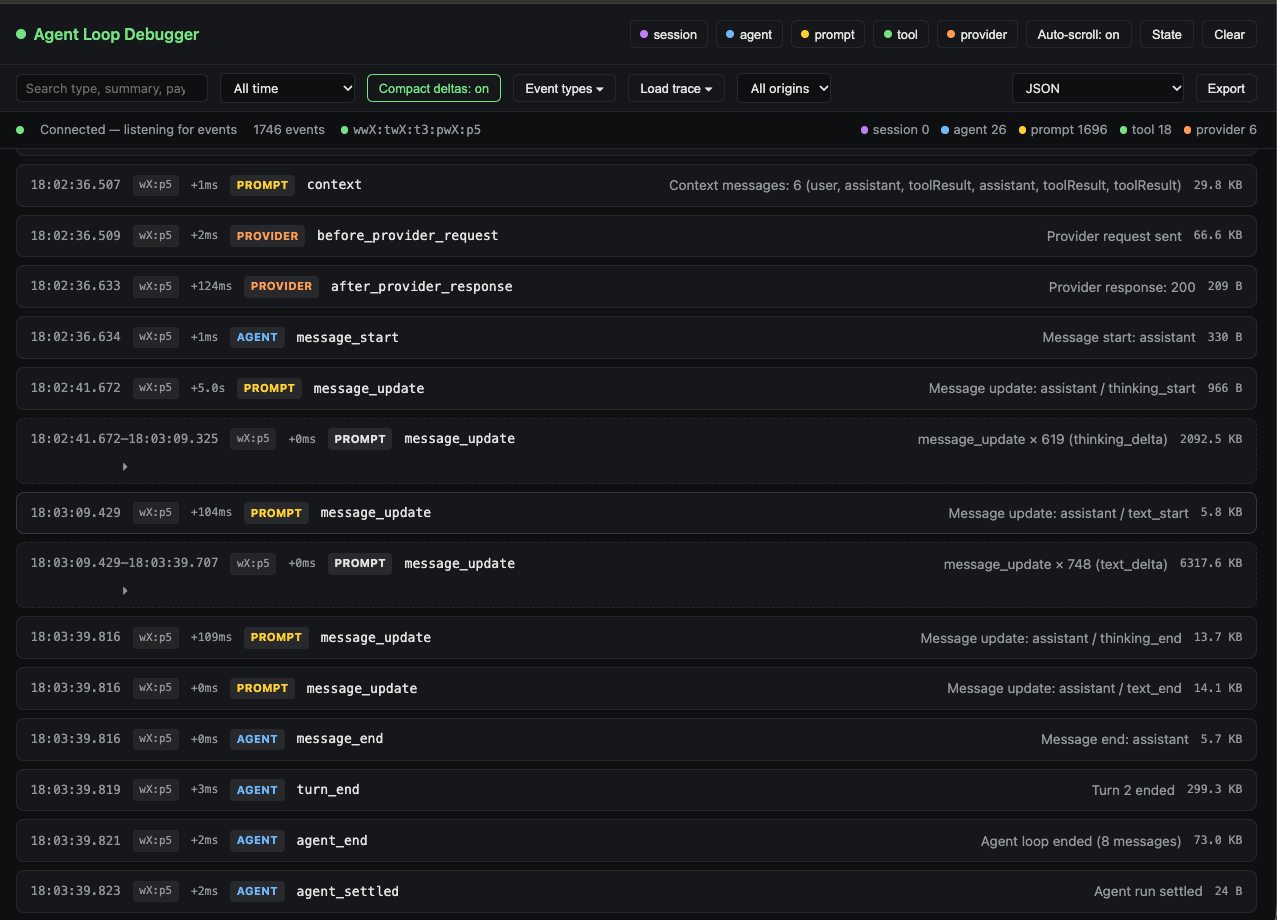
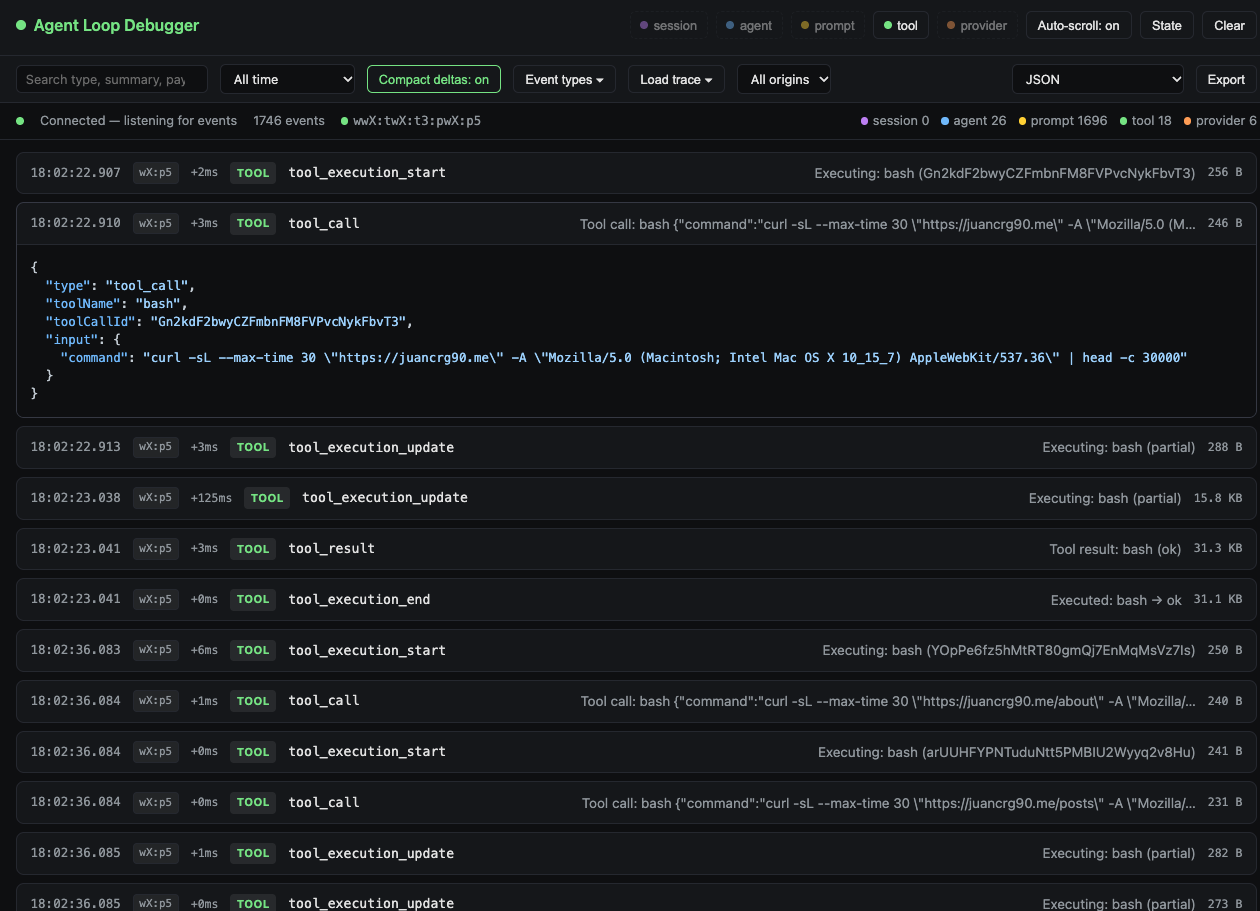
- Category toggles — show or hide events by category.
- Event type filter — dynamically discover event types and toggle each one on or off.
- Text search — filter events by text in the event type, summary, or stringified payload. Input is debounced so filtering stays responsive.
- Time range filter — show only events from the last 30 seconds, 1 minute, 5 minutes, or all time, relative to the most recent event.
- Compact deltas — collapse 3+ consecutive
message_updateevents of the same delta type into a single compact row. Click the row (or the expand arrow) to inspect every individual delta. - Visible metadata — each row shows the latency since the previous event and the stringified payload size. The status bar shows live counts for every category.
- Auto-scroll — automatically scroll to the newest event; pause if you scroll up manually.
- Load trace — load a previously saved trace from
~/.pi/agent/agent-loop-debugger/traces/back into the timeline. - State inspector — open a side panel to inspect the current system prompt, active tools, and context usage.
- Export trace — download the currently filtered view as JSON, a self-contained HTML timeline, or a Markdown table. The export respects category, type, search, time range, and compact-mode settings.
- Clear — clear the timeline display without affecting the server buffer.
Trace persistence
The event buffer is automatically persisted to disk as a JSON trace on
session_shutdown and whenever the debugger server stops. Traces live in:
~/.pi/agent/agent-loop-debugger/traces/agent-loop-<timestamp>.jsonUse /agentloop list to see saved traces and /agentloop load <index|filename>
to replay one. The webapp also has a Load trace dropdown that lists and
loads saved traces on demand.
State inspection
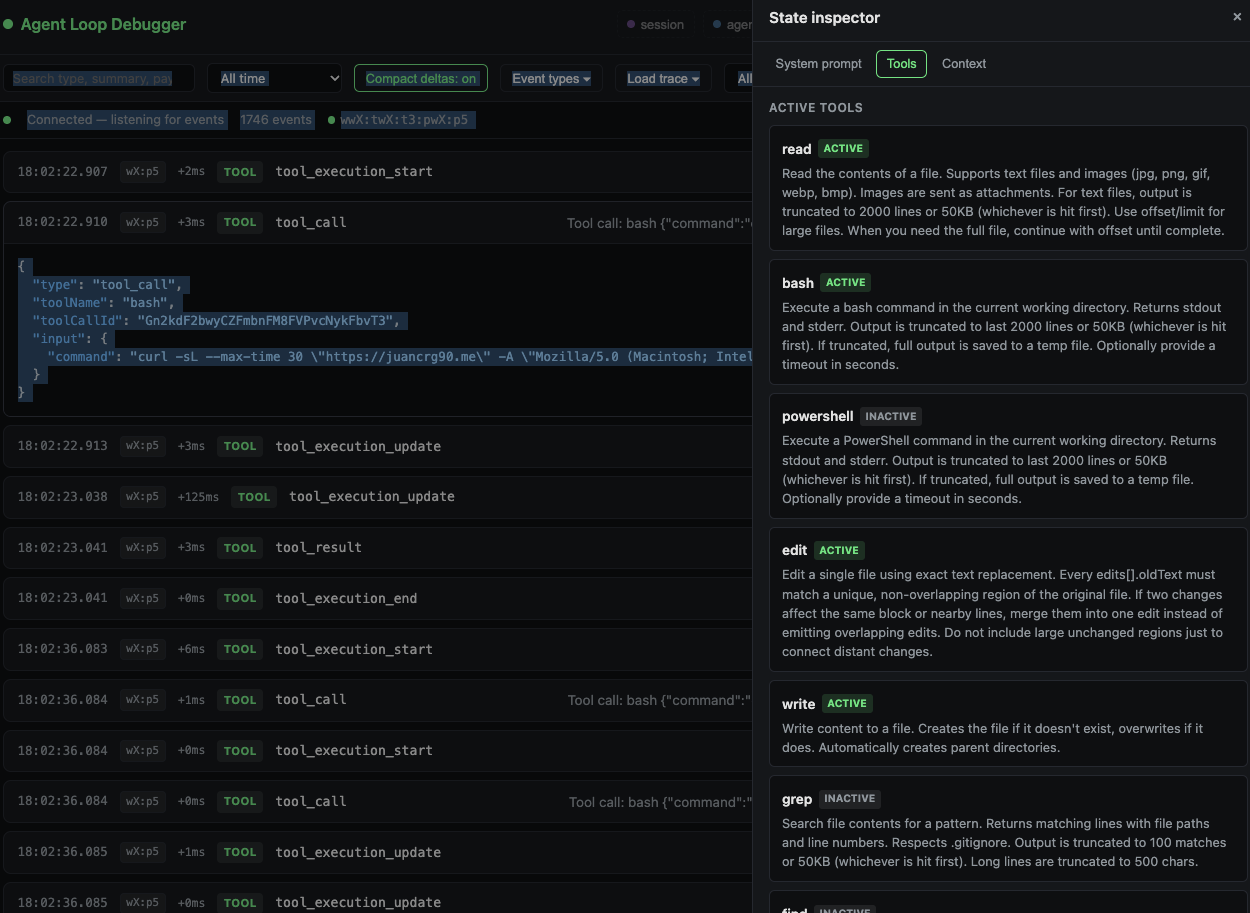
The debugger captures Pi runtime state and exposes it through the webapp's State panel:
- System prompt — the effective system prompt and the options used to build it.
- Tools — all configured tools with descriptions, marked as active or inactive.
- Context usage — current token count, context-window size, and usage percentage.
State is refreshed automatically while the panel is open.
Herdr awareness
When the extension loads inside a Herdr-managed session (HERDR_ENV=1), it
reads HERDR_PANE_ID, HERDR_TAB_ID, and HERDR_WORKSPACE_ID and attaches
that origin metadata to every recorded event:
{
  // ...existing DebuggerEvent fields
  origin?: {
    paneId?: string;
    tabId?: string;
    workspaceId?: string;
  };
}
In the webapp:
- An origin badge appears next to the timestamp for events that carry Herdr metadata. Hover to see the full pane/tab/workspace IDs.
- An origin filter dropdown appears once any Herdr metadata is seen, letting you show only events from a specific pane.
- The status bar shows a compact Herdr indicator derived from the latest event's origin (e.g.,
w1:t2:p3).
Use /agentloop --herdr to print the current Herdr context, and expect the
server startup notification to include the pane ID when running under Herdr.
Saved traces preserve the origin field and it is restored when loading a trace.
Event categories
- session — session start/shutdown and related session events.
- agent — agent loop lifecycle, turns, and message start/end.
- prompt — context assembly and assistant message streaming updates.
- tool — tool calls, execution, and results.
- provider — provider request/response events.
Events are normalized to a common schema:
{
  id: string;
  timestamp: number;
  category: "agent" | "tool" | "prompt" | "provider" | "session";
  type: string;
  summary: string;
  payload: unknown;
}
The server keeps the last 1000 events in memory and replays them to new browser connections before streaming live events.
Known event caveats
The current Pi API (@earendil-works/pi-coding-agent) does not expose the
following event names mentioned in the original intent:
agent_before_settleprovider_stream_eventcontext_with_system
The extension registers the available equivalents instead:
agent_settledbefore_provider_request/after_provider_responsecontext
Development
pnpm --filter @juancrg90/agent-loop-debugger typecheck
pnpm --filter @juancrg90/agent-loop-debugger test
License
MIT