@mobrienv/pi-otlp
OpenTelemetry metrics and events extension for pi-coding-agent
Package details
Install @mobrienv/pi-otlp from npm and Pi will load the resources declared by the package manifest.
$ pi install npm:@mobrienv/pi-otlp- Package
@mobrienv/pi-otlp- Version
0.2.0- Published
- Feb 12, 2026
- Downloads
- 24/mo · 6/wk
- Author
- mobrienv
- License
- MIT
- Types
- extension
- Size
- 2.6 MB
- Dependencies
- 5 dependencies · 1 peer
Pi manifest JSON
{
  "extensions": [
    "src/index.ts"
  ]
}
Security note
Pi packages can execute code and influence agent behavior. Review the source before installing third-party packages.
README
pi-otlp
OpenTelemetry metrics extension for pi-coding-agent. Track sessions, turns, tool usage, token consumption, costs, and performance timing.
Installation
pi install npm:@mobrienv/pi-otlp
Or add to ~/.pi/agent/settings.json:
{
  "extensions": ["~/path/to/pi-otlp"]
}
Configuration
Enable via environment variables:
# Required: enable the extension
export PI_OTLP_ENABLE=1

# Choose exporters (console, otlp, or both)
export OTEL_METRICS_EXPORTER=console

# For OTLP export (e.g., to Grafana, Datadog, or any OTLP-compatible backend)
export OTEL_METRICS_EXPORTER=otlp
export OTEL_EXPORTER_OTLP_ENDPOINT=http://localhost:4318/v1/metrics

# Optional: export interval (default: 60000ms)
export OTEL_METRIC_EXPORT_INTERVAL=10000

# Optional: OTLP headers for authentication
export OTEL_EXPORTER_OTLP_HEADERS="Authorization=Bearer token"

# Optional: debug logging
export PI_OTLP_DEBUG=1
Metrics
Counters
All counters include base attributes: session.id, provider, model
| Metric | Description | Additional Attributes |
|---|---|---|
pi.session.count |
Sessions started | — |
pi.turn.count |
Agent turns (tool-calling loops) | — |
pi.tool_call.count |
Tool invocations | tool.name |
pi.tool_result.count |
Tool completions | tool.name, success |
pi.prompt.count |
User prompts | prompt.length |
pi.token.usage |
Token consumption | type (input/output/cache_read/cache_write) |
pi.cost.usage |
Cost in USD | type (input/output/cache_read/cache_write) |
Histograms
All histograms include base attributes: session.id, provider, model
| Metric | Description | Unit | Additional Attributes |
|---|---|---|---|
pi.session.duration |
Session duration | seconds | — |
pi.turn.duration |
Turn duration | seconds | — |
pi.tool.duration |
Tool execution duration | seconds | tool.name, success |
Commands
/otlp-status— Show telemetry status (sessions, turns, tools, tokens, costs, durations)
Example Output
OTLP Telemetry Status:
  Sessions: 1
  Turns: 5
  Tool calls: 23
  Prompts: 3
  Tokens: 45231 (in: 38000, out: 6000, cache: 1200/31)
  Cost: $0.0234 (in: $0.0190, out: $0.0044)
  Durations:
    Session: 5.2s last, 4.1s avg
    Turn: 1.2s last, 0.8s avg
    Tool: 91ms last, 64ms avg
  Exporters: otlp
  Endpoint: http://localhost:4318/v1/metrics
OTLP Backend Setup
Grafana Alloy / OpenTelemetry Collector
receivers:
  otlp:
    protocols:
      http:
        endpoint: 0.0.0.0:4318

exporters:
  prometheus:
    endpoint: 0.0.0.0:8889

service:
  pipelines:
    metrics:
      receivers: [otlp]
      exporters: [prometheus]
Local Development with Docker
docker run -d --name otel-collector \
  -p 4318:4318 \
  otel/opentelemetry-collector-contrib:latest
Full Stack Demo
See demo/ for a complete Docker Compose setup with OTLP Collector, Prometheus, and pre-configured Grafana dashboards.
Demo Screenshots
Dashboard overview
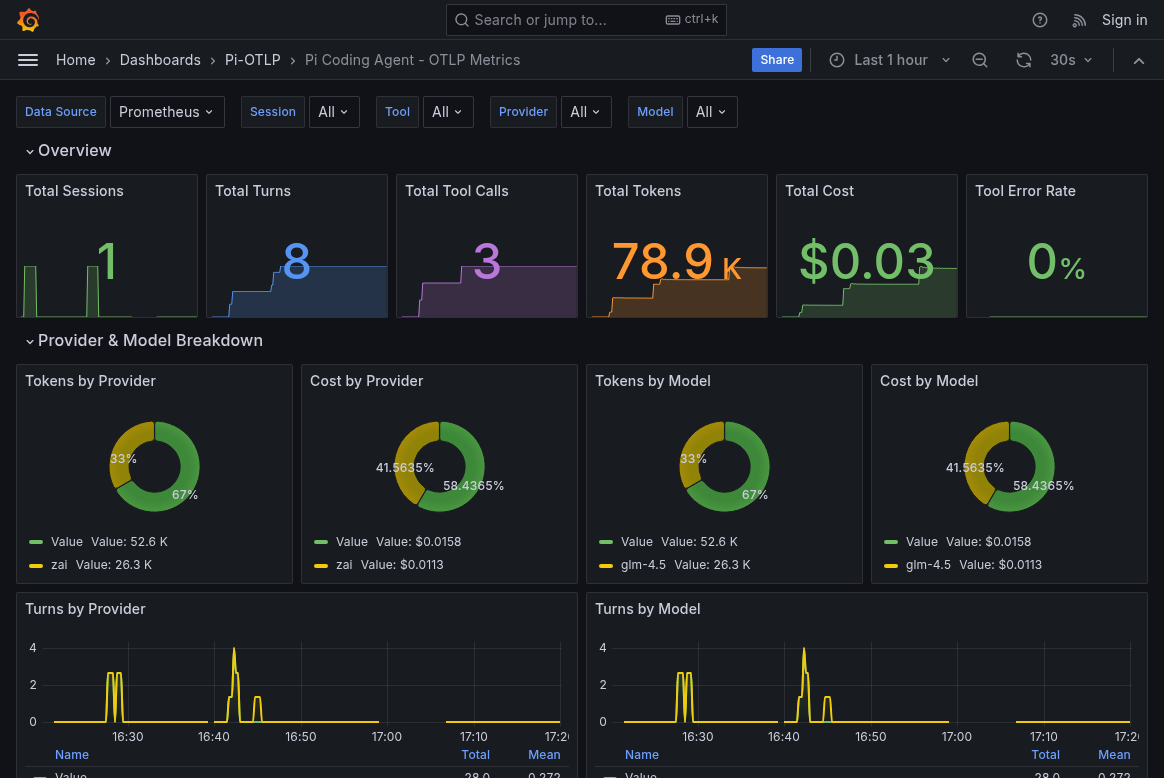
Tokens and cost panels

15-minute activity view

License
MIT