@senad-d/observme
ObservMe: a Pi extension that instruments Pi agent sessions and exports OpenTelemetry traces, metrics, and logs to an external observability stack (OTel Collector, Grafana Tempo/Loki/Prometheus).
Package details
Install @senad-d/observme from npm and Pi will load the resources declared by the package manifest.
$ pi install npm:@senad-d/observme- Package
@senad-d/observme- Version
0.1.1- Published
- Jul 10, 2026
- Downloads
- not available
- Author
- senad-d
- License
- MIT
- Types
- extension
- Size
- 3.6 MB
- Dependencies
- 10 dependencies · 3 peers
Pi manifest JSON
{
  "extensions": [
    "./src/extension.ts"
  ],
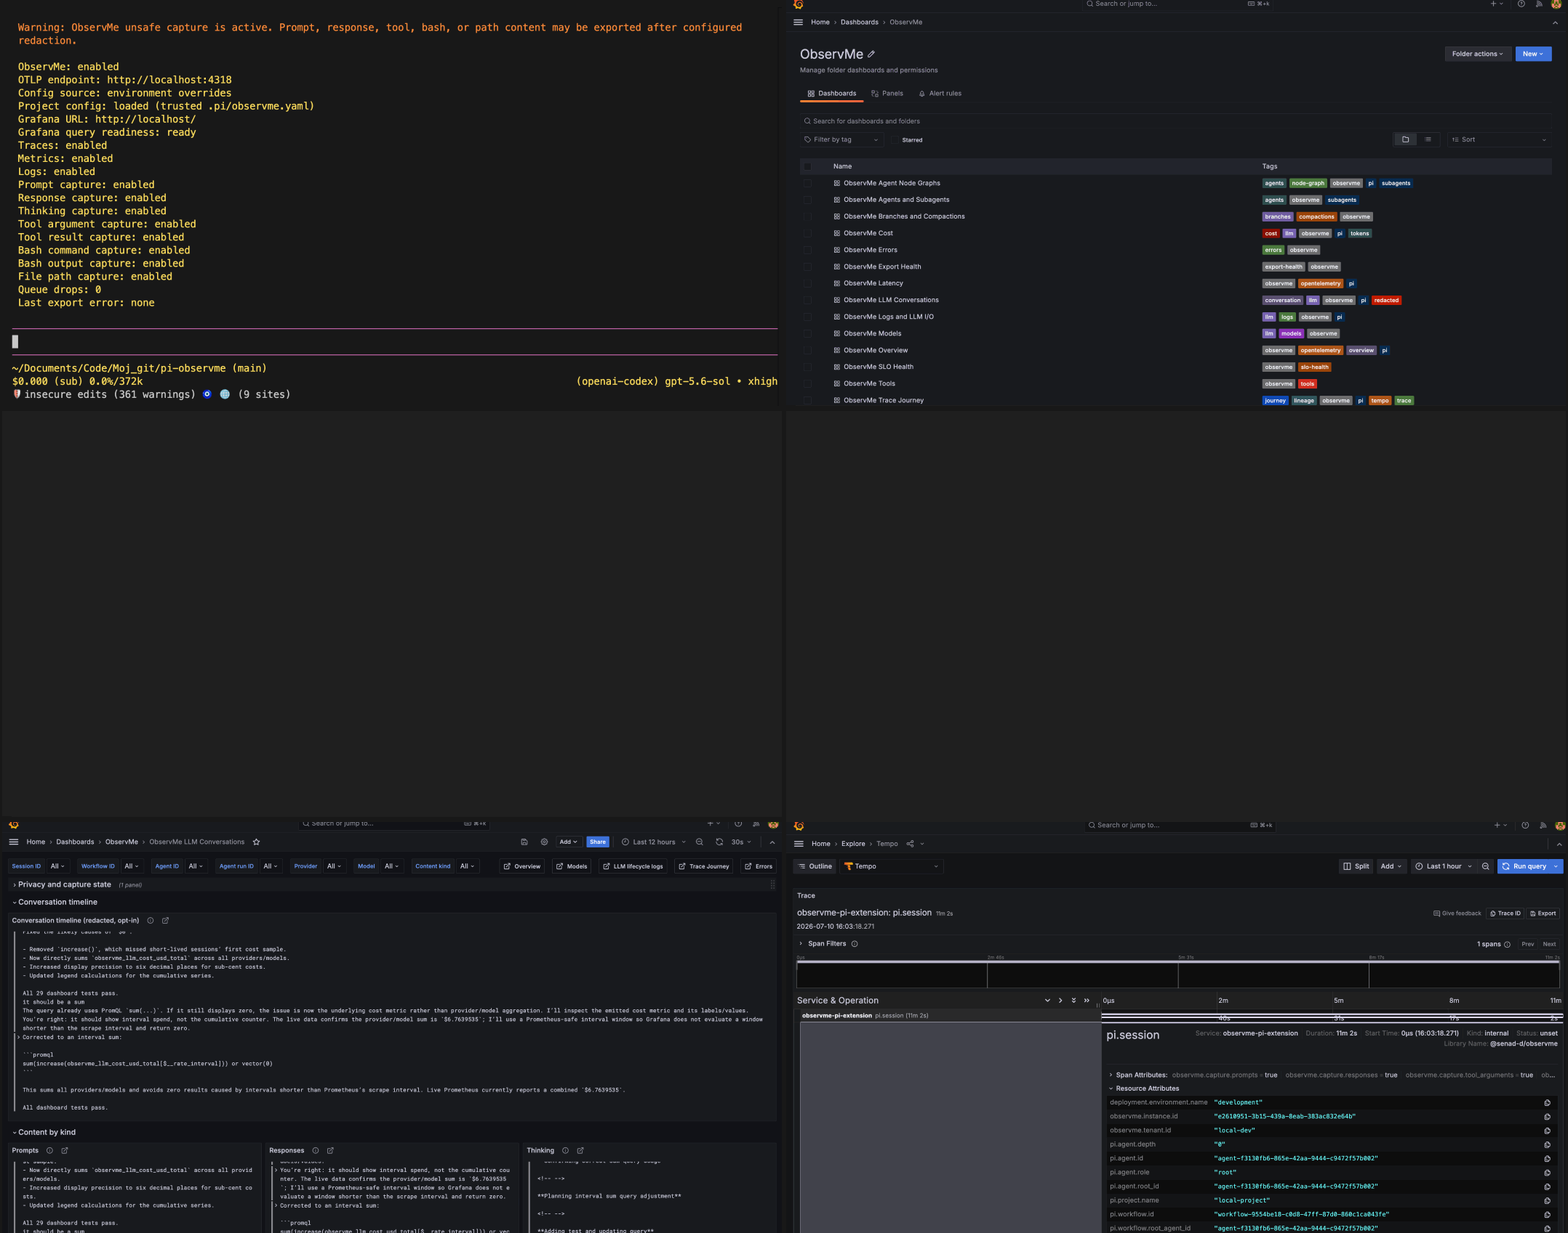
  "image": "https://raw.githubusercontent.com/senad-d/ObservMe/main/img/demo.gif"
}
Security note
Pi packages can execute code and influence agent behavior. Review the source before installing third-party packages.
README
ObservMe maps Pi lifecycle and session events to OpenTelemetry traces, metrics, and logs, then exports them via OTLP to an OpenTelemetry Collector. It uses pi.*, observme.*, and applicable official gen_ai.* attributes. ObservMe is privacy-preserving by default: prompts, responses, thinking content, tool arguments/results, bash commands/output, and file paths are not captured unless explicitly enabled and redacted.
- OTLP-first: emits OpenTelemetry traces, metrics, and logs; no durable local telemetry database.
- Fail open: if the Collector or backend is unreachable, Pi keeps running — telemetry is dropped, never blocking.
- Privacy by default: optional content capture starts disabled and passes through the redaction pipeline when enabled.
- Agent lineage aware: propagates parent/child/root agent identity and W3C trace context across subagent process boundaries without adding high-cardinality identifiers to metric labels.
- Pi-native: usable as a Pi package, project-local install, git install, or local source checkout.
Security: Pi packages run with your full system permissions. ObservMe reads Pi session/event data through Pi's extension API, does not execute shell commands itself, and sends telemetry only to configured OTLP endpoints. Read
SECURITY.md.
Table of Contents
- Implementation Status
- Quick Start
- Installation
- Commands
- Architecture
- Configuration and Privacy
- Safety Model
- Dashboards and Examples
- Documentation Set
- Development
- Publishing
- License
Implementation Status
This checkout implements the ObservMe MVP scope from the packaged ObservMe-Production-Docs/00-README.md design overview:
- Extension load checks and
/obs healthbackend checks. - Session, workflow, agent-run, turn, LLM, tool, bash, subagent-spawn, wait/join, compaction, branch, model-change, and thinking-level telemetry.
- Multi-agent tree metrics for active agents, depth, fan-out, orphan agents, trace-context propagation failures, child failures, and workflow duration.
- Session-scoped OTLP trace, metric, and log exporters with bounded queues, timeouts, and shutdown flushing.
- Configurable capture controls, redaction, path scrubbing, hashing, truncation, and high-cardinality metric-label guards.
- Grafana dashboard JSON, alert rules, SLO definitions, Collector examples, and compatibility matrix artifacts.
- Unit, contract, integration, chaos/failure, performance, package, and smoke-test coverage in the validation pipeline.
The repository version is currently 0.1.0. Run the validation commands below before publishing or deploying a release build.
Quick Start
Use this checklist to confirm telemetry end to end. You need a supported Pi installation; see the compatibility matrix. If you already have an OTLP Collector and Grafana stack, skip the first step.
1) Start the included local stack
The local stack is available in a repository checkout, not in the npm package:
git clone https://github.com/senad-d/ObservMe.git
cd ObservMe/observability-stack
cp .env.example .env
mkdir -p secrets
if [ ! -s secrets/grafana_admin_password ]; then
  openssl rand -hex 24 > secrets/grafana_admin_password
fi
chmod 600 secrets/grafana_admin_password
docker compose up -d
2) Install the extension
cd /path/to/your/project
pi install npm:@senad-d/observme
For local-stack credentials or other environment variables, copy .env.example from an ObservMe checkout to the project as .env. Keep secrets out of .pi/observme.yaml.
3) Start Pi and check connectivity
pi
Inside Pi, run:
/obs status
/obs health
/obs session
/obs trace
4) Generate and inspect telemetry
In the running Pi session, start a normal task, such as:
Summarize this repository in one sentence
Open your configured Grafana URL, then open ObservMe Overview and confirm that the task produced traces, logs, and metrics. ObservMe never blocks Pi execution when the backend is unavailable.
On the first trusted session_start for a project, ObservMe creates observme.yaml under Pi's exported project config directory (.pi/observme.yaml in the standard distribution) when the file is missing. The starter keeps raw prompt, response, thinking, tool, bash, and path capture disabled by default; opt in only to the specific redacted capture fields you need.
Run from a source checkout
git clone https://github.com/senad-d/ObservMe.git
cd ObservMe
npm ci
npm run validate
pi --no-extensions -e .
Installation
| Scope | Command | Notes |
|---|---|---|
| Global | pi install npm:@senad-d/observme |
Loads in every trusted Pi project. |
| Project-local | pi install npm:@senad-d/observme -l |
Writes to .pi/settings.json in the current project. |
| One run | pi -e npm:@senad-d/observme |
Try without changing settings. |
| Git | pi install git:senad-d/ObservMe |
Install from Git; use a tag or commit when you need a fixed version. |
| Local checkout | pi --no-extensions -e . |
Develop or test this repository. |
Commands
All commands are registered under /obs.
| Command | Description | Backend access |
|---|---|---|
/obs status |
Shows local ObservMe enablement, OTLP endpoint, config source/trust status, Grafana query URL/readiness, signal enablement, capture flags, queue drops, and last export error. | Local state only |
/obs health |
Checks Collector, Grafana, and configured datasource reachability with bounded timeouts. | Collector/Grafana |
/obs session |
Shows current-session turn, LLM-call, tool-call, cost, and trace-link state from runtime counters. | Local state only |
/obs cost |
Queries Prometheus/Mimir for safe model/provider token and cost aggregates. | Prometheus/Mimir via Grafana |
/obs trace |
Returns a Grafana Tempo trace link for current, last-turn, or safe session-id scopes. | Grafana link construction |
/obs link |
Direct Grafana trace-link helper using the configured URL template. | Grafana link construction |
/obs tools |
Queries tool-call and tool-failure aggregates using only safe tool/error labels. | Prometheus/Mimir via Grafana |
/obs errors |
Queries Loki for recent failed/dropped/orphan event names and renders a capped summary. | Loki via Grafana |
/obs logs |
Queries Loki for the current session's normalized pi_session_id label and renders a capped summary. |
Loki via Grafana |
/obs agents |
Shows current workflow/agent identity, lineage, fan-out/depth, active children, orphan status, and wait/join hints. | Local state plus safe Tempo/Prometheus drill-downs |
/obs backfill |
Optional historical replay for the current session with explicit confirmation, replay markers, redaction, export rate limits, and a bounded --since window up to 30d. |
OTLP export when confirmed |
Query-backed commands enforce configured timeouts and result limits and reject raw prompt, command, path, or other sensitive query inputs.
Trace visibility note: /obs trace and /obs session can link to the current trace as soon as session_start creates it. During an active Pi session, Tempo may show ended child spans before the long-lived root pi.session span appears; the canonical root span is ended, flushed, and visible after session_shutdown.
Architecture
Pi Agent
  └── ObservMe Pi Extension
        ├── OTEL Traces  ──► OTEL Collector ──► Tempo
        ├── OTEL Metrics ──► OTEL Collector ──► Prometheus / Mimir
        └── OTEL Logs    ──► OTEL Collector ──► Loki

Grafana
  ├── Tempo datasource
  ├── Loki datasource
  └── Prometheus/Mimir datasource
The extension factory in src/extension.ts only registers handlers and commands. OTEL SDK startup happens from session_start, and bounded flush/shutdown happens from session_shutdown, so importing or registering the extension does not open exporters, timers, or sockets.
See ObservMe-Production-Docs/02-reference-architecture.md for the full architecture. Implementation planning specs are repository-only and live at https://github.com/senad-d/ObservMe/tree/main/specs. A reference Docker Compose deployment of the Grafana/Tempo/Loki/Prometheus/Collector stack is also repository-only at https://github.com/senad-d/ObservMe/tree/main/observability-stack because it contains generated local credentials and state placeholders.
Configuration and Privacy
ObservMe supports layered configuration with this precedence:
defaults → global ~/.pi/agent/observme.yaml → trusted project config → trusted project .env → system environment variables → runtime options
The extension automatically creates <project>/<CONFIG_DIR_NAME>/observme.yaml (<project>/.pi/observme.yaml in the standard distribution) the first time Pi emits session_start in a trusted project and the file does not already exist. It uses Pi's exported config-directory name and serialized file-mutation queue. Pi emits that lifecycle for startup, /reload, new-session, resume, and fork flows; ObservMe attempts the same idempotent bootstrap for each trusted flow, skips untrusted projects or contexts without ctx.cwd, and never overwrites an existing file. Edit this file for project-specific setup: otlp.endpoint / otlp.signalEndpoints for your Collector, resource.attributes for service/project/tenant/environment identity, capture and privacy for content visibility, and query.grafana plus query.links.traceUrlTemplate for /obs Grafana commands. The generated starter keeps content-capture flags disabled, privacy.redactionEnabled: true, and privacy.allowUnsafeCapture: false; for local debugging, set only the needed capture.* flags to true and keep redaction enabled. Keep secrets out of YAML; use environment variables or a trusted project .env for values such as OBSERVME_OTLP_TOKEN, OBSERVME_GRAFANA_TOKEN, OBSERVME_GRAFANA_PASSWORD, and OBSERVME_HASH_SALT. See docs/configuration.md for the quick configuration guide.
Factory-safe loading uses defaults/global/system-environment/runtime options only. Session-scoped loading can add trusted project config and a project-local .env when Pi marks the project trusted. /obs status reports the effective config source, whether project-local config was loaded, skipped because the project is untrusted, or missing, plus bounded rejection issue codes, the configured Grafana URL, and query-readiness status without rendering tokens or passwords. In untrusted projects, ObservMe does not read project-local config or .env files and uses safe defaults/global/system-environment layers instead. Invalid or unsafe configuration emits a bounded config.rejected diagnostic and falls back safely without exposing rejected values.
Cross-process agent lineage has a separate boundary: only the Pi process environment available to the shipped extension, or explicit runtime options for controlled embedders, is eligible for parent provenance. Project-local .env values configure ObservMe but cannot establish lineage. A child accepts only a complete validated workflow/parent/root/depth/spawn envelope and valid W3C context; malformed or stale envelopes fail open to a root/orphan fallback with sanitized telemetry.
Default capture policy:
capture:
  prompts: false
  responses: false
  thinking: false
  toolArguments: false
  toolResults: false
  bashCommands: false
  bashOutput: false
  filePaths: false
privacy:
  redactionEnabled: true
  allowUnsafeCapture: false
  allowInsecureTransport: false
workflow:
  enabled: true
When optional content capture is enabled, live telemetry and /obs backfill use the same policy. With privacy.redactionEnabled: true, the redaction pipeline applies size guards, secret detection, optional PII detection, cross-platform absolute-path scrubbing (hash, basename, full, or drop), custom regex redactors, truncation metadata, and tenant-salted hashing before export. POSIX, Windows-drive, and UNC paths are scrubbed without treating normal URLs or harmless slash-separated prose as paths. Redaction failures drop content and emit redaction.failed diagnostics. With privacy.redactionEnabled: false and privacy.allowUnsafeCapture: true, captured content is exported raw but still truncated to the configured limit. Hash salts are read from secure environment/runtime config, not hardcoded.
To show failed-tool output such as GuardMe denial messages in the Tools dashboard, explicitly set capture.toolResults: true (or OBSERVME_CAPTURE_TOOL_RESULTS=true) while keeping redaction enabled and providing OBSERVME_HASH_SALT. New failed calls then emit a separate tool.error.captured content log; normal tool.call.failed operational logs remain content-free.
Metadata such as token counts, duration, status, model/provider, tool name, and agent role/depth is captured by default. High-cardinality identifiers (session IDs, workflow IDs, agent IDs, trace/span IDs, entry IDs) are allowed on spans/logs for drill-down but are blocked from Prometheus metric labels.
Grafana-backed query commands use the Grafana HTTP API, so browser login cookies are irrelevant. Configure either a Grafana service-account token (OBSERVME_GRAFANA_TOKEN) or local Basic auth (OBSERVME_GRAFANA_USERNAME/OBSERVME_GRAFANA_PASSWORD); token auth takes precedence and secrets are never rendered in command errors. You can supply these values as system environment variables before starting Pi, or copy the .env.example shipped with ObservMe to .env in a trusted project; system environment variables override .env values.
Supported local-stack query profile
The repository-only local stack at https://github.com/senad-d/ObservMe/tree/main/observability-stack supports /obs query commands through authenticated Grafana behind nginx HTTPS at https://observability.local. The default Compose stack does not publish Grafana on localhost:3000; use that direct HTTP path only if you add your own override.
query:
  enabled: true
  links:
    traceUrlTemplate: https://observability.local/explore?left=...
  grafana:
    url: https://observability.local
    token: ${OBSERVME_GRAFANA_TOKEN}
    username: admin
    password: ${OBSERVME_GRAFANA_PASSWORD}
    datasourceUids:
      tempo: tempo
      loki: loki
      prometheus: prometheus
    tls:
      insecureSkipVerify: true
    transport:
      preferIPv4: true
Create a Grafana service-account token in Grafana (Administration → Users and access → Service accounts → Add service account/token; Viewer is enough for read-only datasource queries) and export it as OBSERVME_GRAFANA_TOKEN, or for local-only Basic auth read the generated admin password from the repository-only local stack's secrets directory. If you prefer a project-local env file, run cp .env.example .env, fill either OBSERVME_GRAFANA_TOKEN or OBSERVME_GRAFANA_PASSWORD, then restart Pi from that project. The local Collector and Loki profile uses service.name=observme-pi-extension; Loki queries use normalized labels such as service_name, pi_session_id, pi_agent_id, pi_agent_run_id, event_name, and event_category. If data is visible in Grafana but /obs commands fail, run /obs health and check extension env loading, Grafana auth, datasource UIDs, TLS, and DNS details.
Show LLM chat content in Grafana
LLM prompt, response, and thinking bodies are hidden by default. To display redacted chat content in Tempo span attributes and Loki log panels, restart Pi with explicit capture and a tenant hash salt:
export OBSERVME_CAPTURE_PROMPTS=true
export OBSERVME_CAPTURE_RESPONSES=true
export OBSERVME_CAPTURE_THINKING=true
export OBSERVME_REDACTION_ENABLED=true
export OBSERVME_HASH_SALT="$(openssl rand -hex 32)"
For intentionally raw local debugging only, set OBSERVME_REDACTION_ENABLED=false together with OBSERVME_ALLOW_UNSAFE_CAPTURE=true. Environment variables and trusted project .env values override .pi/observme.yaml, so remove stale overrides before relying on YAML privacy settings.
Only new LLM events emitted after these settings and the updated Collector are active can show content; older telemetry dropped by the Collector cannot be recovered. Open the ObservMe LLM Conversations dashboard for a dedicated opt-in chat timeline. Do not query Grafana with raw prompt or response text.
Full configuration schema: ObservMe-Production-Docs/12-configuration-reference.md. Full redaction/privacy design: ObservMe-Production-Docs/06-security-privacy-redaction.md.
Safety Model
- ObservMe does not execute shell commands itself; it only observes tool/bash execution events emitted by Pi.
- ObservMe never blocks Pi agent execution when the observability backend is degraded or unreachable.
- ObservMe starts exporters only for a trusted session and shuts them down with bounded timeouts.
- ObservMe does not continuously tail the full Pi session file; startup recovery reads only minimal session/correlation state, and historical replay requires an explicit
/obs backfillcommand. - Optional content capture is disabled by default and must pass through the redaction pipeline before export when enabled.
/obsquery commands are read-only and are not imported by telemetry-emission code paths.- Invalid or unsafe configuration falls back to safe defaults with bounded
config.rejected,/obs status, and available Pi UI diagnostics; rejected values are never rendered. Intentionally unsafe capture emits a visible warning.
See SECURITY.md and ObservMe-Production-Docs/06-security-privacy-redaction.md for details.
Dashboards and Examples
These assets are included in the npm package:
- Grafana dashboards:
dashboards/observme-*.json, including Overview, SLO Health, Export Health, Trace Journey, Agents, Agent Node Graphs, Cost, Models, Latency, Tools, Errors, Logs and LLM I/O, LLM Conversations, and Branches/Compactions. - Alert rules:
dashboards/observme-alerts.yaml. - SLO definitions:
dashboards/observme-slos.yaml. - Supported local-stack ObservMe config:
examples/observme.yaml. - Production Collector config with high-cardinality and content-drop processors:
examples/collector.yaml. - Compatibility matrix:
docs/compatibility-matrix.md.
Open ObservMe Overview first for health/SLO chips, workload, cost, latency, agent-lineage status, and time-preserving links to focused dashboards. Use Trace Journey to follow a session/workflow/agent/run across Prometheus aggregates, Loki logs, and Tempo traces. Use LLM Conversations only for redacted opt-in content; raw prompt, response, command, path, and error-message values should never be placed in dashboard URLs or Prometheus labels. Empty failure tables normally mean no matching failures in the selected range, while optional content panels can be empty because capture is disabled by default.
The full dashboard map, standard variables, drill-down workflow, threshold colors, and zero-state semantics are documented in ObservMe-Production-Docs/09-dashboards-alerts-slos.md.
Documentation Set
docs/configuration.md: quick configuration guide.docs/compatibility-matrix.md: supported Pi, Node.js, OpenTelemetry, and local-stack versions.docs/validation-flow.md: secret-safe Grafana and/obstroubleshooting flow.ObservMe-Production-Docs/: architecture, configuration, privacy, dashboards, and operational reference docs.SECURITY.md: security reporting and package safety guidance.
Development
npm ci
npm run validate
Useful checks:
npm run typecheck
npm run typecheck:test
npm run lint        # TypeScript, test TypeScript, ESLint, formatting, and script syntax checks
npm run lint:fix    # ESLint auto-fix pass
npm run format:check
npm run test
npm run test:integration:collector
npm run test:integration:grafana-stack
npm run check:pack
npm run smoke:pi-runtime
npm run validate:grafana-obs
pi --no-extensions -e .
npm run smoke:pi-lifecycle runs lifecycle handlers with traces, metrics, logs, and query integration disabled through an explicit offline test config. npm run smoke:pi-runtime launches a real Pi RPC process against a temporary trusted project, verifies /obs discovery plus /obs status and /obs session routing after session_start, and exercises a bounded /obs cost timeout against a local deterministic Grafana backend.
npm run test:coverage writes coverage/node-test-coverage.txt and SonarQube-readable coverage/lcov.info for the default non-Docker test suite; coverage/ is git-ignored, and rm -rf coverage removes generated coverage artifacts after review. Docker integration coverage is opt-in with OBSERVME_INCLUDE_INTEGRATION_COVERAGE=1 npm run test:coverage.
End-to-end troubleshooting flow: docs/validation-flow.md provides a deterministic, secret-safe checklist and script for the common user-facing case where Grafana has data but /obs commands are failing.
Publishing
ObservMe publishes to npm as @senad-d/observme. Run from a clean working tree after validation and a CHANGELOG.md update.
npm login
npm whoami
npm run validate
npm run validate:grafana-obs  # with the release-candidate stack and Grafana query env configured
npm version <version>
npm publish --access public
Push the release commit and tag after the package is published.
License
MIT