@spences10/pi-observability
Optional live event stream and local web dashboard for Pi agent sessions
Package details
Install @spences10/pi-observability from npm and Pi will load the resources declared by the package manifest.
$ pi install npm:@spences10/pi-observability- Package
@spences10/pi-observability- Version
0.1.0- Published
- Nov 4, 2026
- Downloads
- 512/mo · 390/wk
- Author
- spences10
- License
- MIT
- Types
- extension
- Size
- 1.7 MB
- Dependencies
- 2 dependencies · 2 peers
Pi manifest JSON
{
  "image": "https://raw.githubusercontent.com/spences10/my-pi/main/assets/pi-package-preview.png",
  "extensions": [
    "./dist/index.js"
  ]
}Security note
Pi packages can execute code and influence agent behavior. Review the source before installing third-party packages.
README
@spences10/pi-observability




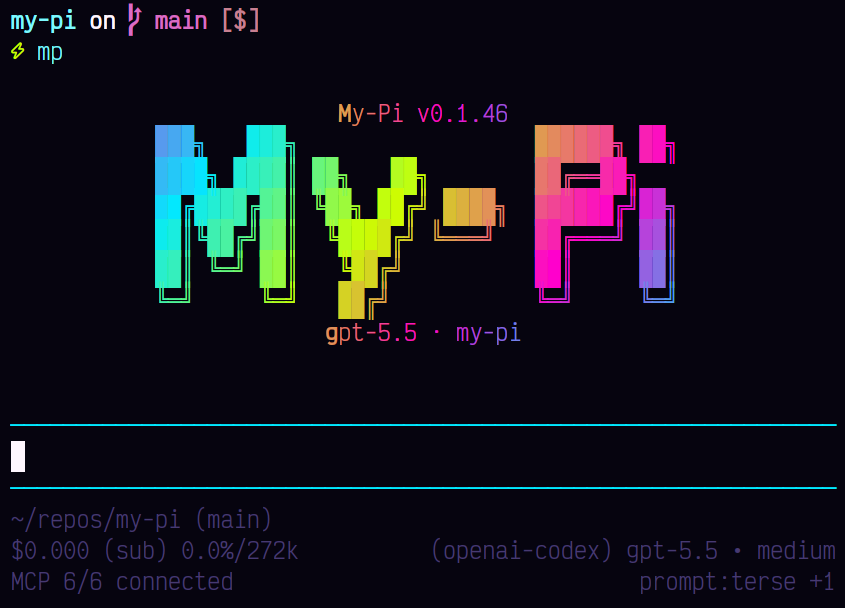
Live local observability for Pi sessions. When enabled, the extension auto-starts a local server, streams redacted lifecycle events to it, and serves a browser dashboard with overview, sessions, tools, and per-session trace views, updated live over Server-Sent Events.
Installation
pi install npm:@spences10/pi-observabilityLocal development from this monorepo:
pnpm --filter @spences10/pi-observability run build
pi install ./packages/pi-observability
Usage
With the package installed, start Pi as usual, then open the browser
dashboard from the TUI with /observability. Use /observability tui
for the terminal dashboard.
To start the dashboard server directly:
pnpx pi-observability-serverDefaults:
http://127.0.0.1:43190
~/.pi/agent/observability.db
Server environment variables:
MY_PI_OBSERVABILITY_HOST=127.0.0.1
MY_PI_OBSERVABILITY_PORT=43190
MY_PI_OBSERVABILITY_DB=~/.pi/agent/observability.db
MY_PI_OBSERVABILITY_TOKEN_FILE=~/.pi/agent/observability-token
MY_PI_OBSERVABILITY_RETENTION_DAYS=14
MY_PI_OBSERVABILITY_MAX_EVENTS=100000
MY_PI_OBSERVABILITY_MAX_BODY_BYTES=1048576
MY_PI_OBSERVABILITY_DETAIL=detailed # detailed or summary
MY_PI_OBSERVABILITY_TOKEN=dev-token
Agent process environment variable:
MY_PI_OBSERVABILITY_FORWARD_SESSION_ID=true # opt-in provider attributionThe local API requires bearer authentication by default. On first
startup, the server creates a random token in
~/.pi/agent/observability-token with mode 0600. The token is
shared by Pi sessions using the fixed local server; a separate random
token per agent session would break pooled ingestion. Set
MY_PI_OBSERVABILITY_TOKEN to manage the value explicitly. The TUI
command and server startup output provide a dashboard URL whose
fragment carries the token to the browser without sending it in an
HTTP query string. The browser removes the fragment and sends the
token only in the Authorization header. The dashboard includes:
- Overview — cost, turns, tool calls, tool error rate, tokens, and model latency (p50/p95) for the selected time range, with cost and turns per day, the slowest tools, and recent sessions.
- Sessions — every session in the range with turns, tool errors, tokens, and cost, searchable and filterable by project.
- Tools — calls, errors, p50/p95/max duration, and total time per tool.
- Tools also lists recent failures across sessions with their error output; each links to the failing span in its session trace.
- Session detail — totals, estimated context tokens/capacity and
percentage with a snapshot timestamp, a per-turn chart of model,
tool, and unattributed time, and tabs:
- Trace (default) — each prompt as a timeline of turns, model
calls, and tool calls on a shared time axis, with nested tool
calls under their parent. Prompt groups are newest first, with
reduced-motion-aware arrival animations; activity inside each
prompt stays chronological. Collapse all / Expand all also
controls newly arriving prompts. Failed spans are outlined and
marked; "Failures only" and "Next failure" find them. Selecting a
span opens a drawer with its full input, error output, exit code,
tokens, cost, captured assistant response text for model calls,
and the raw events, and puts the span in the URL (
&span=<id>). Model calls show the requested model and, when the provider reports it, the actual responding model. Routed calls are labeledrequested → respondingin the trace; both IDs stay available in the span drawer. - Turns, Tools, Events (searchable, with a JSON payload drawer), and Context (cwd, session file, model, reasoning settings, and initial prompts).
- Trace (default) — each prompt as a timeline of turns, model
calls, and tool calls on a shared time axis, with nested tool
calls under their parent. Prompt groups are newest first, with
reduced-motion-aware arrival animations; activity inside each
prompt stays chronological. Collapse all / Expand all also
controls newly arriving prompts. Failed spans are outlined and
marked; "Failures only" and "Next failure" find them. Selecting a
span opens a drawer with its full input, error output, exit code,
tokens, cost, captured assistant response text for model calls,
and the raw events, and puts the span in the URL (
- Commands, JSON payloads, and prompts are highlighted with twinkleplop.
The time range applies to every aggregate view. Live events refresh
the open view about once a second; pause updates from the header.
Views live in the query string (/?view=tools,
/?view=session&session=<id>).
The dashboard reads these authenticated JSON endpoints:
/stats/overview, /stats/tools, /stats/sessions,
/stats/failures (each takes an ISO since), /sessions/<id>/spans,
and /sessions/<id>/timeline.
Trace token and cost rollups follow Pi's persisted session accounting.
They include assistant responses, nested LLM usage returned by tools,
compaction summaries, and branch summaries exactly once. The session
file is authoritative; message lifecycle events are used only when
persisted usage is unavailable. These cumulative totals complement the
timing and event data rather than representing the active context
window. The separate context display uses Pi's native
ctx.getContextUsage() estimate, including the active model's context
capacity. Unknown usage after compaction stays unknown until a new
response; older events without snapshots show unavailable, not zero.
Interrupted turns are marked in the trace and Turns tab. Their duration ends at the last observed activity before a resume, shutdown, new prompt/turn, or branch navigation; unobserved gaps are excluded. A later turn's end and usage are never attributed to the interrupted turn. Unattributed time is the remaining elapsed time after recorded model and tool time, not a measured breakdown of extension overhead. See the turn pairing implementation and regression tests.
Advanced configuration
By default the extension uses http://127.0.0.1:43190 and starts the
local server if needed. Set a URL only when sending events to a custom
or already-running server:
MY_PI_OBSERVABILITY_URL=http://127.0.0.1:43190 piWith auth and grouping:
MY_PI_OBSERVABILITY_URL=http://127.0.0.1:43190 \
MY_PI_OBSERVABILITY_TOKEN=dev-token \
MY_PI_OBSERVABILITY_POOL=team-demo \
MY_PI_OBSERVABILITY_TAG=agent-a,experiment-1 \
pi
Equivalent extension flags:
--observability-url
--observability-token
--observability-pool
--observability-tag
--observability-name
--observability-raw
--observability-detail
--observability-forward-session-id
--observability-disable
--no-observability
What it records
Events are stored as ordered envelopes with:
- session id, session file, cwd
- pool, tags, optional friendly agent name
- provider and model when available
- event type, timestamp, monotonic session sequence
- redacted payload summary
The extension listens for session, agent, turn, message, tool, provider, model, compaction, and branch events when the installed Pi version emits them.
Failed tool calls keep their full text output as errorText and the
exit code as exitCode (detailed mode), after redaction.
Some events are reduced before they are sent:
tool_execution_updateevents are not stored. The extension counts them and adds the count totool_execution_endasupdateCount.provider_requeststores the requestinstructions(the system prompt) as a fingerprint (lengthand a 16-charactersha256prefix). Theagent_startevent keeps the prompt preview.- Detailed message summaries keep
role,stopReason,errorMessage,durationMs, andthinkingLevel, so provider latency and errors are available independently of response text. In detailed mode, assistantmessage_endevents also keep visible text asresponseText, capped at 16,000 characters with an explicitresponseTextTruncatedflag and normal secret redaction. Thinking, images, and tool arguments are excluded from this text capture. Summary mode and older events omit it; the drawer explains when text was not captured or the response was tool-only. Both summary modes keep the requestedmodeland provider-reportedresponseModelIDs. Older events and providers withoutresponseModelcontinue to show only the requested model; the dashboard does not infer a response ID.
Context snapshots are recorded at session start/shutdown, before a prompt, after a turn/run, and after compaction, branch navigation, and model selection. Turn-end capture happens after message persistence, so context reflects Pi's session projection rather than cumulative billing counters. Snapshots retain unknown/unavailable values rather than falling back to an older estimate. See the event capture implementation.
provider_response depends on the provider transport. Pi emits
after_provider_response only for HTTP responses. The openai-codex
provider uses WebSocket by default, so this event appears only when it
falls back to SSE. Use durationMs on assistant message_end events
for provider latency. Session renames update stored dashboard metadata
from Pi's native session_info_changed event. /sessions and
/events/stream support pool, tag, and session_id filters where
relevant.
SQLite schema
The schema source is src/schema.sql in this package. The current
schema version is tracked with PRAGMA user_version (version 2).
Databases from a newer version fail fast.
At ingest the server copies these values from the payload into
events columns: turn_index, tool_call_id, tool_name,
is_error, duration_ms, stop_reason, input_tokens,
output_tokens, cache_read_tokens, cache_write_tokens,
cost_usd, error_text, exit_code, and parent_tool_call_id.
Token and cost columns are set on message_end only.
Two views join the events into spans:
tool_spans— one row per tool execution, with duration, error flag, and update count.turn_spans— one row per completed or interrupted agent turn, with duration, an interruption flag, provider and tool time, tool calls and errors, tokens, and cost. Active turns without an end or interruption boundary remain visible in the trace rather than this completed/interrupted breakdown.
Upgrading an older database adds the columns, fills them from the
stored payloads, and runs one VACUUM to enable
auto_vacuum = INCREMENTAL. After that, retention pruning returns
freed pages to the file system.
Safety
By default payloads use MY_PI_OBSERVABILITY_DETAIL=detailed, which
keeps allowlisted nested values useful for debugging while still
summarizing large arrays/objects and recursively redacting secrets.
Set MY_PI_OBSERVABILITY_DETAIL=summary or
--observability-detail summary for key-only nested object summaries.
Raw payload mode is opt-in with --observability-raw or
MY_PI_OBSERVABILITY_RAW=true; redaction still applies. Redaction
replaces the values of keys that look like credentials (for example
api_key, authorization, access_token). Keys that count tokens,
such as totalTokens or max_tokens, are kept.
Events have no size cap by default; retention
(MY_PI_OBSERVABILITY_RETENTION_DAYS,
MY_PI_OBSERVABILITY_MAX_EVENTS) bounds the database. Set
MY_PI_OBSERVABILITY_MAX_PAYLOAD_BYTES on the agent process to cap
each event. The server rejects request bodies over
MY_PI_OBSERVABILITY_MAX_BODY_BYTES; the extension then sends smaller
batches, and stores a single event that is still too large as a
truncated preview (or drops it if the preview is too large).
This extension's generic x-pi-session-id attribution header is
disabled by default. Enable --observability-forward-session-id, or
set MY_PI_OBSERVABILITY_FORWARD_SESSION_ID=true on the agent
process, not only on a separately launched observability server.
Either option adds the stable local Pi session identifier to every
outgoing provider request, so enable it only for endpoints you trust.
The observability bearer token, pool, tags, and event payloads are
never added to provider headers.
This setting controls only the extension's generic header. Pinned Pi
0.82.0 independently sends the same stable identifier as
x-opencode-session, plus x-opencode-client: pi, by default for
OpenCode, OpenCode Go, and requests to an OpenCode host.
The dashboard shell and static assets are public on the configured
listener, but event ingestion, queries, trace data, and live streams
require an exact Authorization: Bearer ... header. URL query tokens
are rejected. The token file protects against other local OS users and
drive-by browser requests. The server also enforces mode 0600 on the
database and its WAL/SHM files. It cannot isolate data from other
processes running as the same account, which can already read the
local database directly.
This package does not read .env files automatically. Pass only the
configuration you want through environment variables or flags.
Development
pnpm --filter @spences10/pi-observability run check
pnpm --filter @spences10/pi-observability run test
pnpm --filter @spences10/pi-observability run build
License
MIT