@twkrash/pi-session-inspector
Local Pi session analytics for token usage, cost, models, tools, subagents, skills, and history
Package details
Install @twkrash/pi-session-inspector from npm and Pi will load the resources declared by the package manifest.
$ pi install npm:@twkrash/pi-session-inspector- Package
@twkrash/pi-session-inspector- Version
1.4.0- Published
- Sep 21, 2026
- Downloads
- 926/mo · 926/wk
- Author
- twkrash
- License
- MIT
- Types
- extension
- Size
- 1.2 MB
- Dependencies
- 2 dependencies · 2 peers
Pi manifest JSON
{
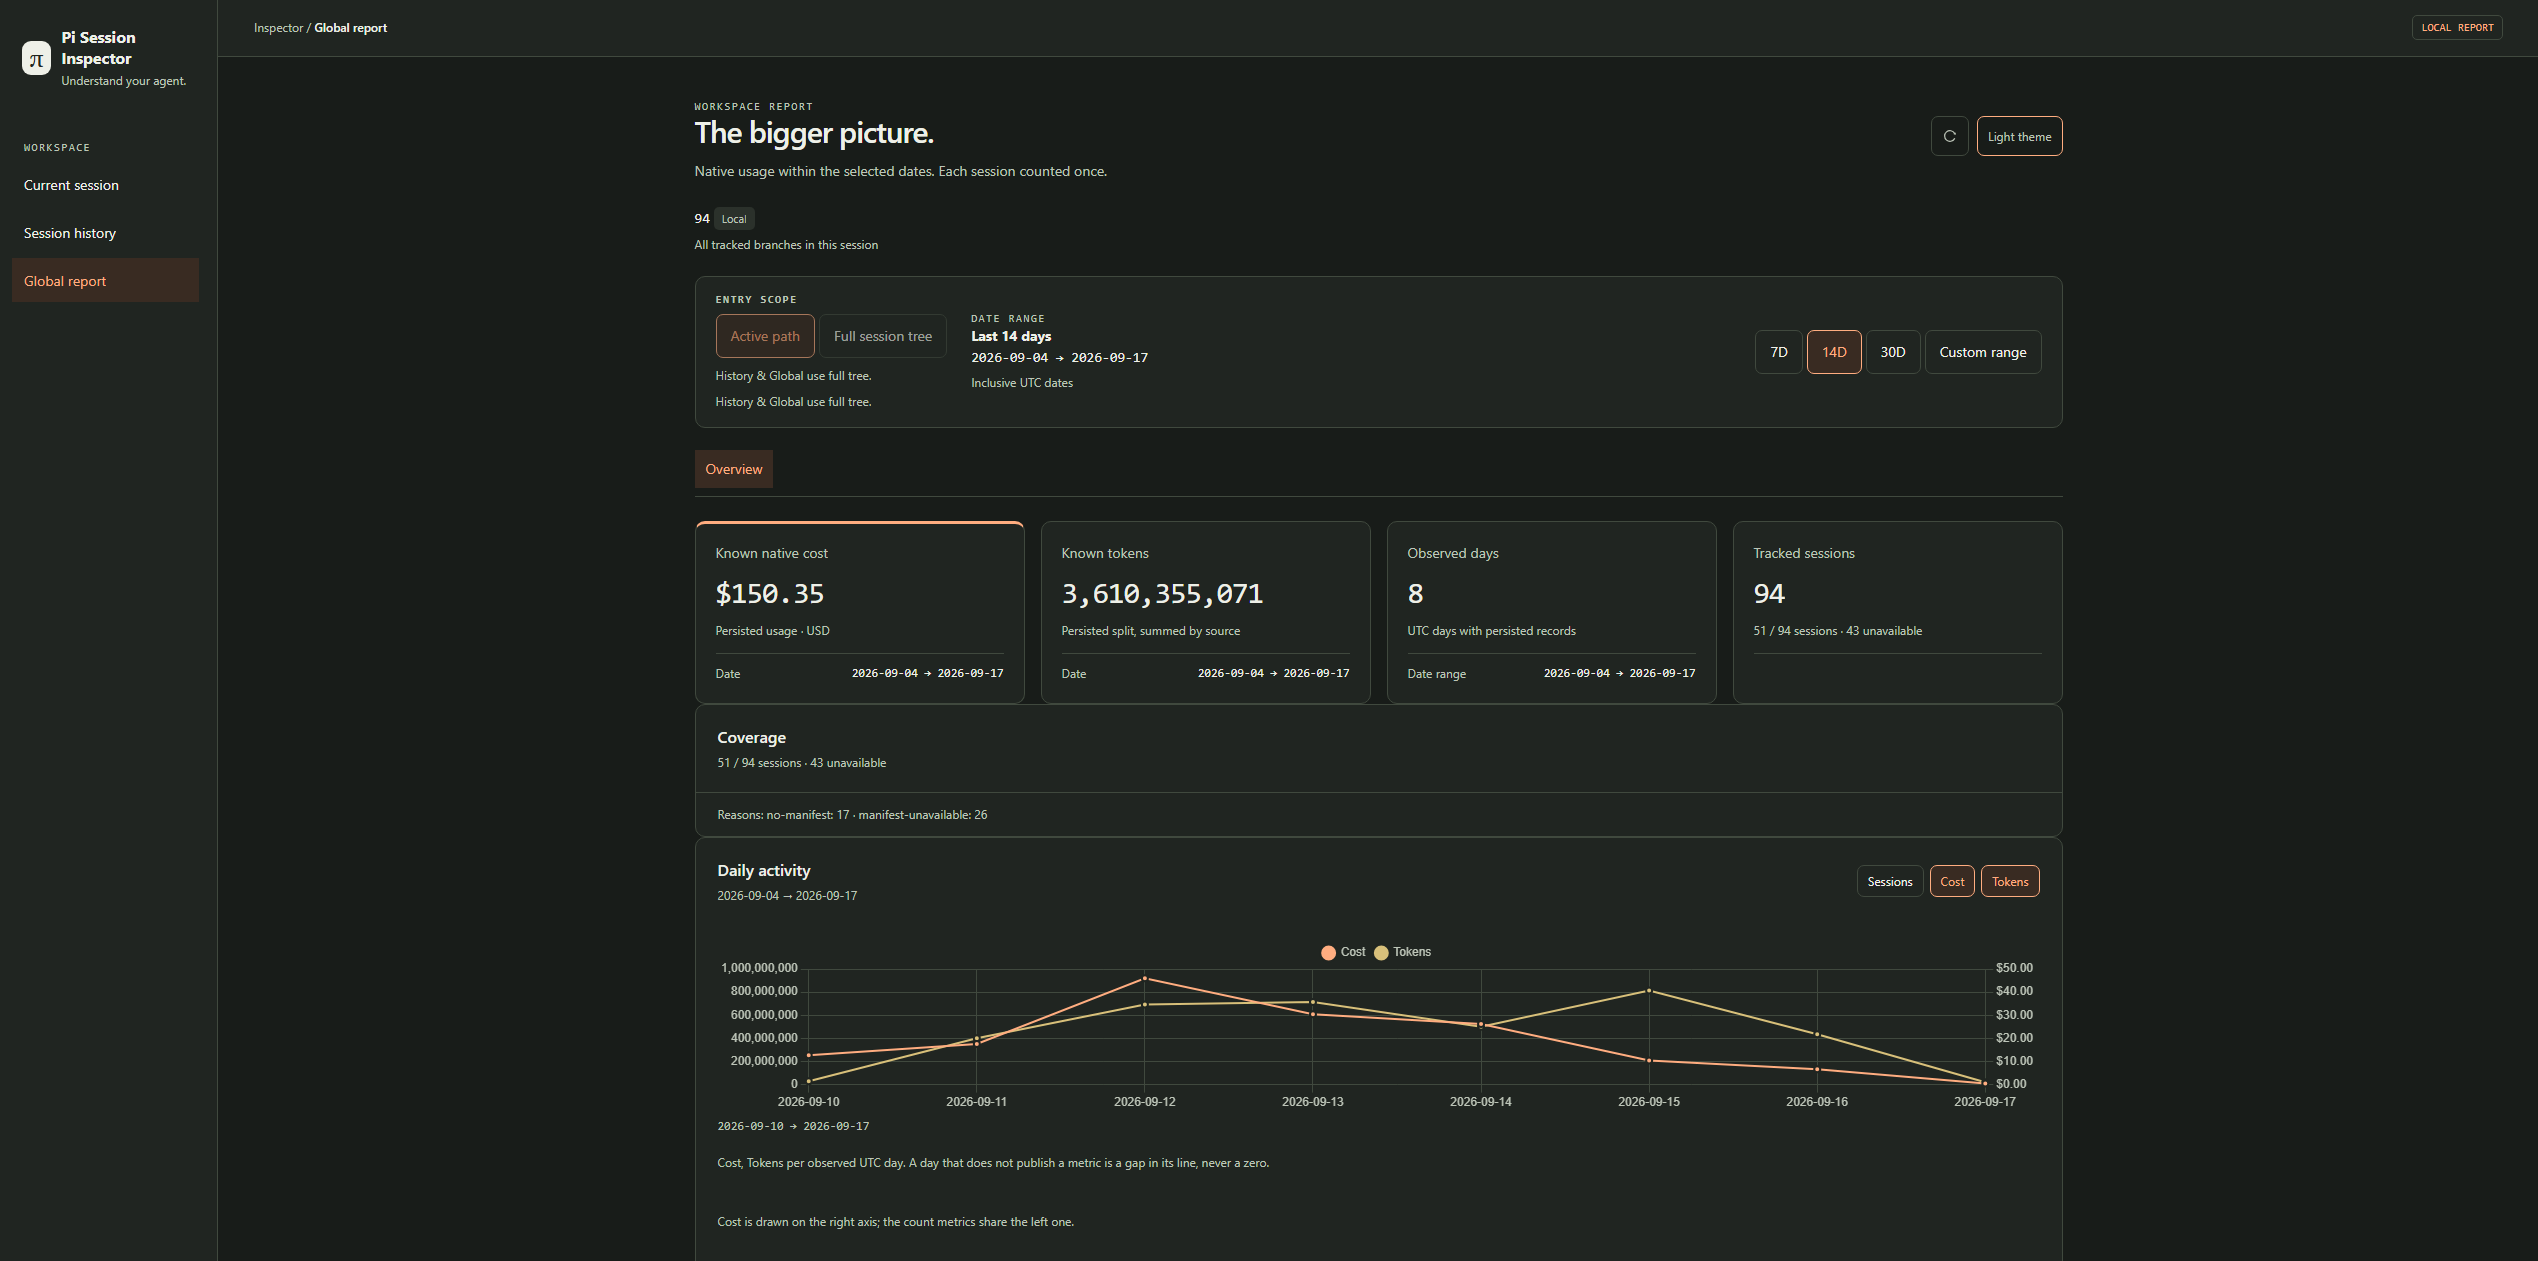
  "image": "https://raw.githubusercontent.com/twKrash/pi-session-inspector/main/docs/images/overview-global-dark.png",
  "extensions": [
    "./src/index.ts"
  ]
}
Security note
Pi packages can execute code and influence agent behavior. Review the source before installing third-party packages.
README
Pi Session Inspector
See where your Pi tokens, cost, models, tools, and subagents actually went.
Local-first session analytics for Pi — no external database, no analytics service, no session uploads.



What is Pi Session Inspector?
A deterministic, local-only observability layer for Pi sessions. Inspector reconstructs what Pi already persisted — usage and cost, generations, tool calls, compactions, errors, agent runs — and augments it with bounded live and cooperative evidence when a producer publishes some. There is no LLM analytics step, no cloud service, and no daemon: nothing leaves the machine and no model call is spent on analysis.
It reads that data in place and reports it four ways — the interactive localhost UI, the TUI inside Pi, a self-contained immutable HTML snapshot, and the deterministic JSON report DTO — over the current session, one historical session, the session history, or the global aggregate.
Status
1.4.0: current-session, history, global, ledger, localhost UI, in-Pi TUI, immutable HTML snapshots, deterministic JSON reports, themcpsemantic integration, and native token economics/cache accounting are available. The localhost UI paints the configured theme before any report data arrives, and its loading state announces once.
Install
pi install npm:@twkrash/pi-session-inspector
/session-inspector
A Pi package runs with full system access, so install it the way you install any other Pi package: from a source you have reviewed. Inspector's own guarantees are narrower than that — it reads Pi's persisted session data and writes only its own metadata — and are described under Guarantees.
The bare install tracks releases. To hold one version, pin it:
pi install npm:@twkrash/pi-session-inspector@1.4.0
/session-inspector with no arguments is tui current in active scope: the
TUI opens inside Pi for the current session. The alias /session-ins is
equivalent, and /session-inspector help prints the grammar in the TUI.
Screenshots
The same global report in the light theme.
The images are GitHub release assets rather than repository files: no binary bytes enter git, and the absolute URLs render on GitHub and npm alike. They are plain inline images, so nothing is linkable or downloadable from the click — a right-click save is still the browser's own affordance.
What you can inspect
| Surface | What it shows |
|---|---|
| Overview | Native session usage and cost, generations, tool calls, and errors for the selected range, a daily activity chart whose metrics the reader picks, plus an evidence panel that keeps native, live/cooperative, and unavailable inputs apart |
| LLM | Generation-attributed model usage and cost for the range; the same tab's Agent execution tree carries the session's own native total |
| Agent execution | The LLM tab's second subject: Tree and Table readings of the same subagent runs — nested topology, run containers, model, status, and partial child usage. Grouping nodes are presentation only (see Agent execution) |
| Tools | Calls with duration and per-row usage coverage; partial usage and partial duration are flagged, never averaged away |
| Skills | Discovered skill inventory plus explicit invocation evidence only |
| Integrations | Semantic telemetry from supported Pi extensions (see below) |
| Environment | Discovered commands and capability sources (the builtin, npm:… providers an environment loads) — availability, never activity |
| Errors | Persisted error records by bounded kind |
| Ledger | Chronological generations, tools, compactions, branch summaries, and errors with their status and confidence |
| History / Global | Historical session rows and the multi-session aggregate report, each with its own inspection coverage |
| Snapshot / JSON | Deterministic export surfaces: one self-contained HTML document, or the report DTO itself |
Accounting and evidence rules
Session total          all persisted native Pi usage in the selected range:
                       generations + tool results + compactions + branch summaries
Model usage            the generation-attributed slice only
Child (subagent) usage breakdown of subagent usage already inside native
                       tool-result usage — never added a second time
- Unavailable is not zero. A figure that was never observed renders unavailable; an observed zero stays zero. Counters are never fabricated.
- Partial coverage is explicit. Coverage counts,
N of M runs reported usagefractions, and partial flags travel with the rows they qualify. - Pi session JSONL is the durable usage/cost authority. Native usage and cost are read from it; no live or cooperative source outranks it for native accounting.
- Live and cooperative evidence enriches attribution. It can supply timing, correlation, and producer facts; it never replaces, inflates, or re-derives native accounting.
- Token economics stay native. Overview and export surfaces retain input,
output, cache-read, cache-write, reasoning, and native bucket costs when Pi
provides them. Cache reuse is
cacheRead / (input + cacheRead + cacheWrite); its denominator and coverage are shown, and missing evidence stays unavailable rather than becoming zero.
Integrations
Inspector distinguishes two things:
- Generic resource discovery — commands, skills, tools, and tool sources
are inventoried and shown as availability, and
/skill:<name>invocations are counted generically. No extension needs to do anything for this. - Semantic integration — Inspector understands a producer's bounded, structured protocol and turns its evidence into reportable facts. Not every extension needs one, and one is added only when the producer publishes a real telemetry contract.
Shipped integrations (full contract):
| Integration | Evidence it reads | Reported telemetry |
|---|---|---|
context |
ctx_* custom entries plus native ctx_* tool calls, folded by maximum |
calls |
rtk |
message.details.rtkCompaction (versioned shapes collapse to one contract) |
compactions, char/line counts, truncated |
ponytail |
ponytail-mode custom entries |
changes |
caveman |
caveman-level custom entries |
changes |
permission |
live permissions:ready, permissions:ui_prompt, permissions:decision |
decisions, allowed, denied, prompts, prompt detail counters, gateErrors |
subagents |
persisted native subagent tool results | Rich run and activity evidence in the Agents view; the row itself declares no counters |
lens |
native lens, lens_*, pi_lens_*, lsp_*, ast_grep_* tool calls |
calls |
mcp |
native mcp, mcpScript, and mcp__<server> tool calls, plus pi-mcp-adapter mcp-approval-v1 entries re-validated against the declared shape, and its pi-mcp-adapter/status/v1 runtime snapshot |
calls, toolApprovals, iframeApprovals, iframeDenials; calls counts invocations of the adapter's own tool surface and only counters with evidence are published; the runtime snapshot is a presence sighting, never a counter, and server/tool names and hashes are never retained |
Presence and evidence are independent claims. Present / Unavailable means the
integration is installed but produced no observable evidence in the tracked
scope — a mode-change integration that was never asked to change mode looks
exactly like that. Unsupported means evidence exists in a shape or version
Inspector does not understand. Installation is never guessed: absent is only
reported when the inventory is readable and the defined signal is missing.
Historical mode rows are validated for compatibility but never become a
report row.
Agent execution
The Agents view inside the LLM tab reads one set of runs two ways.
- The tree's root is a presentation grouping node — the primary session, not an AgentRun — and it is labelled with the session's own native total.
- Models are node attributes, never execution parents.
- A run container groups the runs one producer published. It has no agent, status, model, or usage, because it is not an agent run.
- Nesting is topology, not arithmetic: runs are a breakdown of usage the native tool results already carry and are never added to a native or global total.
- Runs come from persisted producer evidence (
details.results[]anddetails.completions[]), so a completed async run appears once its producer has published durable evidence. A run that currently exists only inside the running process may not be visible yet. - A run with no observed time cannot be placed in a range; the view says so instead of blaming the range for the gap.
Commands
/session-inspector [ui|snapshot|tui|json] [target] [options]
/session-ins ...
/session-inspector help | --help | -h
The four modes are separate surfaces: ui is the interactive localhost
application, snapshot is the only immutable HTML artifact command, tui
renders inside Pi, and json is the deterministic export. Only ui starts a
server.
| Mode | Targets | Options |
|---|---|---|
ui |
none; the application carries its own navigation | --scope active|tree, --theme dark|light, --debug, --no-open |
snapshot |
required: current, history, global, or session <sessionId> |
--scope active|tree (current only), --preset 7|14|30, --from DATE --to DATE, --theme, --debug, --output FILE, --no-open |
tui |
current (default) or ledger |
--scope, --debug |
json |
current (default), history, global, or session <sessionId> |
--scope (current only), --debug, --output FILE |
/session-ins
/session-ins ui --theme dark
/session-ins snapshot current --scope active --preset 14
/session-ins snapshot history --from 2026-01-01 --to 2026-01-31 --no-open
/session-ins snapshot global --output "global.html"
/session-ins snapshot session <sessionId>
/session-ins json history --output report.json
/session-ins json session <sessionId> --output report.json
/session-ins tui ledger
ui displays its tokenized URL and opens it unless --no-open is given, while
snapshot writes its artifact, reports the path, and opens that exact document
unless --no-open is given, without ever starting a server. --no-open
suppresses only the platform browser opener.
--output is valid only for snapshot and json, so ui never writes a file.
Atomic session exports (snapshot session <sessionId> and
json session <sessionId>) take no --scope and no range options: one
requested session, nothing else. Both load that session through the same
historical-session loader and publish the same canonical report DTO; the
snapshot renders its own resolved projection of that DTO, while the JSON export
writes the DTO itself. The range options are snapshot-only; history and global
targets in json use their own full-tree resolution. --format and the old
bare positional targets are removed syntax and are rejected with usage, as is
any invalid combination. The legacy --subagents-artifact option is also
removed: subagent runs are auto-discovered from persisted tool results.
Snapshots are created lazily under Pi's agent directory at
session-inspector/v1/reports/ when --output is omitted. Unsafe/non-portable
identities use an opaque hashed basename. Generated cache expires after 14 days
and is capped at 100 MiB, oldest first; explicit exports are never pruned.
Relative --output paths resolve against the extension process working
directory. An explicit output carries its own extension (.html for
snapshot, .json for json) and never names Pi's own session data: a direct
session-source path (a .jsonl file, or for snapshot anything inside Pi's
session directory) is refused before any read or write. A destination that is a
hard or symbolic link to a session source is not followed: the report replaces
that directory entry atomically, so the session source keeps its own bytes and
inode.
snapshot HTML is one resolved, self-contained file:// artifact: it opens
with no server, runs no JavaScript, performs no network request, carries no
report payload the eye cannot already see, and ships a default-src 'none'
content-security-policy with one hash for its own inlined stylesheet. Repeated
renders of the same projection are byte-identical, and only the chosen theme
changes the bytes.
Settings
Inspector reads one optional JSON file it owns, next to its own data:
<agentDir>/session-inspector/settings.json
{ "theme": "dark", "debug": true }
| Key | Values | Effect |
|---|---|---|
theme |
"light" (default), "dark" |
The theme a ui page and a snapshot document are rendered with: the shell carries it in the first paint, and the in-page toggle still switches the running page |
debug |
true, false (default) |
Writes Inspector's bounded local debug log (0o600 JSONL under session-inspector/v1/debug/) |
Precedence is explicit CLI option > settings.json > product default, so
--theme light overrides "theme": "dark" and a per-invocation --debug
enables logging even when settings leave it off. A missing file is the default
configuration, not an error; a malformed, unreadable, or oversized (over 64 KiB)
file degrades to the product defaults with a bounded diagnostic and never
prevents Inspector from starting. Unknown keys are ignored rather than guessed.
--theme is accepted by ui and snapshot only.
The file carries presentation and diagnostics only. Which integrations Inspector supports, what each descriptor publishes, and how to add one are documented in Integrations.
Building an integration
Adding an ordinary semantic integration should require approximately:
one adapter/definition file
one re-export line in src/integrations/adapters/index.ts
one registration line in src/integrations/index.ts
focused tests for its mapping
one row in the integrations matrix
and should require no integration-specific edits to report key lists, canonical switch statements, retained-counter allowlists, UI integration lists, or report ordering tables. If a new integration seems to need one of those, the hook it needs is missing — add a hook to the contract instead of a name to a list, and let the subsystem that owns that operation iterate it. The composition root is the only place that names integrations, and its array position is the report order.
What Inspector wants from a producer:
- Good evidence: versioned structured events or entries, bounded enums and counters, stable identifiers where correlation is required, and replayable persisted evidence wherever historical reporting matters.
- Bad evidence: prompts, outputs, arbitrary tool arguments or results, filesystem-path inference, regexing prose or error text, and UI presentation labels. None of those becomes a canonical fact, and no presentation-only heuristic is ever promoted into evidence.
Privacy is the reason for that line: Inspector needs semantic facts, not payload content. An integration may read only the bounded fields its hook declares, and never prompts, tool payloads, environment values, secrets, unrestricted paths, or raw producer payloads. Every subsystem fault-isolates per integration: one throwing integration degrades its own row to a bounded reason and never blocks another.
See docs/integrations.md for the descriptor contract, hooks, evidence states, and a complete worked example.
Localhost UI security boundary
ui starts (or reuses) one ephemeral loopback server bound to 127.0.0.1
on an OS-chosen port, and prints the browser URL it serves. Its token is
created in memory per server instance, delivered once in the URL fragment
(http://127.0.0.1:<port>/#token=<token>), removed from the address bar before
the first request, and never written to storage, disk, or a log; a reload or a
new tab loses authentication and asks for a fresh URL. Every API request must
carry that token as Authorization: Bearer. The boundary is exact:
- Only
127.0.0.1is bound; the request'sHostmust be exactly127.0.0.1:<port>, an unexpectedOriginis refused, andForwarded/X-Forwarded-*headers are never trusted. - A request whose peer address is not loopback is refused boundedly. That includes a port-forwarding setup that presents a non-loopback peer: the refusal is the contract, not a case for a broader allowlist.
- Static assets are the three known files (
/,/style.css,/client.js), served by a fixed table withGET/HEADonly.client.jsis a deterministic build-time bundle from readable sources underscripts/web/; route and range logic are not runtime module assets, and the chart library is bundled rather than loaded. The exact/favicon.icocompatibility probe returns empty204forGET/HEADand is not an additional asset. API routes are/api/v1/ui,/api/v1/reports/global, and/api/v1/reports/sessions/<sessionId>withGETonly. - Every response is
no-store,nosniff, andno-referrer; errors are bounded Problem Details that echo no input, and the diagnostics written to stderr carry a bounded code, status and correlation id rather than a session id, a path, or a token.
The browser only navigates, requests, formats and renders: every scope, range, partiality, evidence and unavailable-versus-zero decision comes from the server's own projection.
Guarantees
- Pi session files remain source of truth; Inspector writes only its own metadata/WAL and a namespaced tracking marker.
- Telemetry cannot block or change agent execution.
- WAL excludes prompts, outputs, raw tool arguments/results and provider payloads.
- Metrics label native, live, cooperative, inferred, unavailable, or unsupported evidence.
Reports may still reveal project metadata. Treat exports as sensitive.
Canonical design documentation
- Integrations — supported integrations, how to add one, and integration vs skill vs tool
- Roadmap — milestones and post-1.0 plans
- Pi ecosystem research
- v1 specification
- architecture decisions
These documents and ADRs are canonical. Planning scratch files are not retained as competing authority.
See contributing, security, and agent guidance.
License
MIT © twKrash.