@zhcsyncer/pi-tool-display-intent
Intent-aware tool rendering, diff visualization, and output compaction for Pi.
Package details
Install @zhcsyncer/pi-tool-display-intent from npm and Pi will load the resources declared by the package manifest.
$ pi install npm:@zhcsyncer/pi-tool-display-intent- Package
@zhcsyncer/pi-tool-display-intent- Version
0.10.0- Published
- Sep 7, 2026
- Downloads
- 1,091/mo · 181/wk
- Author
- zhcsyncer
- License
- MIT
- Types
- extension
- Size
- 920.2 KB
- Dependencies
- 0 dependencies · 2 peers
Pi manifest JSON
{
  "image": "https://raw.githubusercontent.com/zhcsyncer/pi-extensions/main/packages/pi-tool-display-intent/assets/demo-aggregate-1.png",
  "extensions": [
    "./extensions/tool-display-intent.ts"
  ]
}
Security note
Pi packages can execute code and influence agent behavior. Review the source before installing third-party packages.
README
pi-tool-display-intent

pi-tool-display-intent is a modified fork of MasuRii/pi-tool-display 0.5.0. It keeps compact tool rendering and adds model-written, user-facing intent. The displaySummary field is adapted from mertdeveci5/pi-tool-display-summary 0.1.0.
read docs/tax-code.pdf — Checking the Colorado tax code
$ pnpm test — Verifying the extension test suite

● Read(docs/tax-code.pdf) — Checking the Colorado tax code
  ⎿ loaded 42 lines
The current model writes displaySummary in the normal tool call. This extension does not make another inference request, use a second model, or need another API key.
Features
- Bash always asks the current model for a
displaySummaryintent. Other built-ins keep deterministic targets only. - Claude-style rows: status mark,
Name(target), and indented results. - Optional
aggregatelayout: one Run ledger per user request, including Agent and consult by default. - Fullscreen mouse support: click a collapsed Run block to expand that run, click its expanded summary to collapse it, and inspect individual call results without rerunning tools.
- Optional context-growth receipts and per-turn badges to spot context-heavy steps.
- Short values-only call previews, indented failure details, and complete key/value arguments in the click-to-open viewer.
- Same compact / summary / preview result modes as upstream.
- Cooperative API so other tools can still opt into the same intent field.
Do not load pi-tool-display, pi-tool-display-summary, and this extension together. They register the same built-in tool names.
Install
pi install npm:@zhcsyncer/pi-tool-display-intent
pi install npm:@zhcsyncer/pi-extensions
Then restart Pi or run /reload.
Use
/tools
/tools aggregate
/tools individual
Empty /tools opens the settings panel. Switching layout asks to reload this session, then saves and reloads. Bash intent language is available in both layouts and applies after /reload; layout-specific display knobs stay in the panel.
Layouts
individual is the default: each tool keeps its own row.
aggregate folds every registered built-in, custom, MCP, and late-loaded tool in one user request into one Run view:
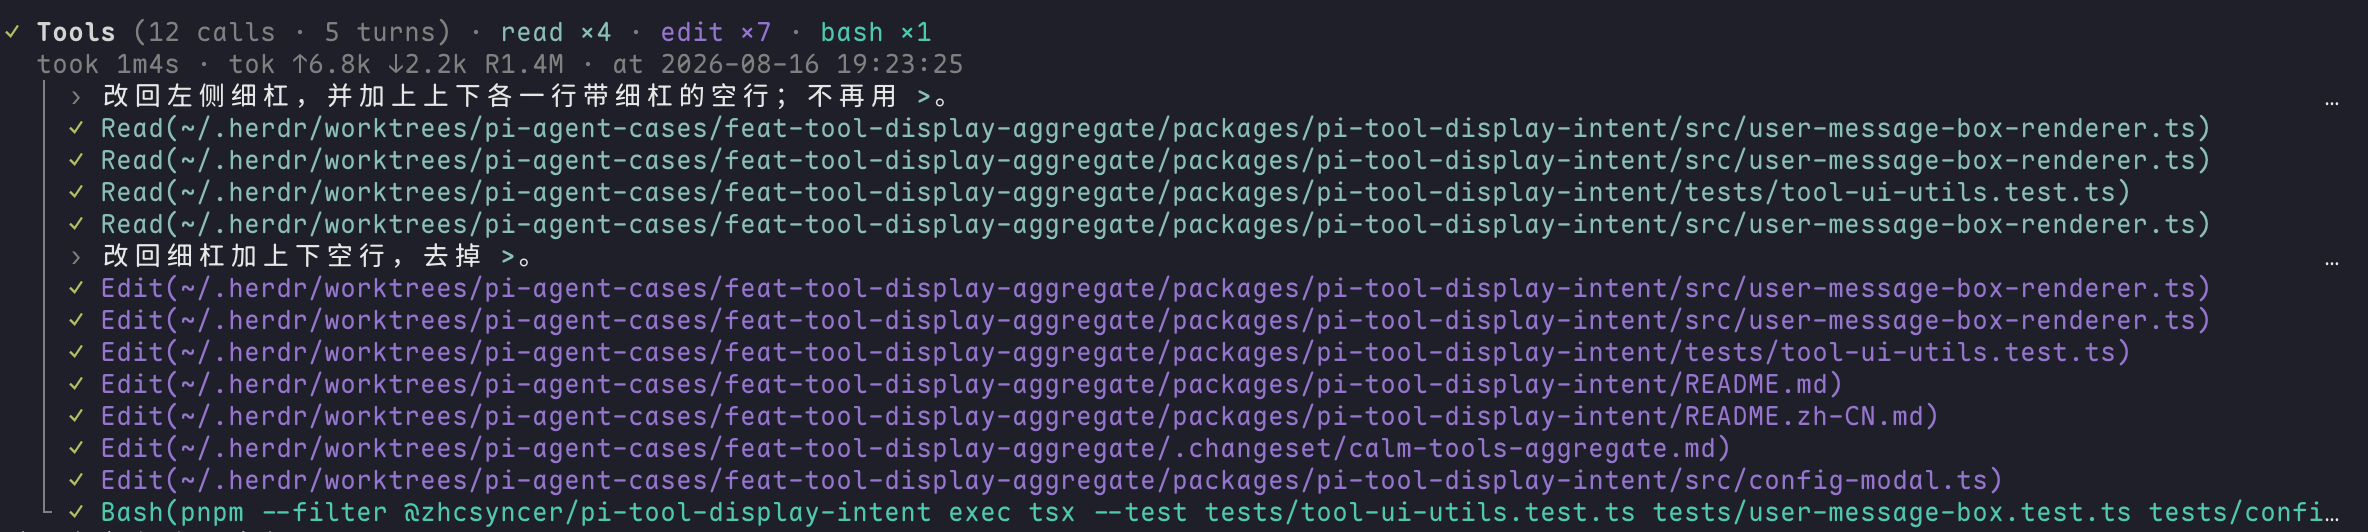

◐ Run (37 calls · 3 turns) · read ×12 · ask_user_question ×1 · edit ×8 · bash ×16
  › 先对照两边入口
  ◐ Bash — 把策略固化成 zone · 54 lines · 2.3KB           12s

✓ Run (38 calls · 3 turns) · read ×12 · ask_user_question ×1 · edit ×8 · bash ×17
  ↳ 2 steers
  took 2m14s · tok ↑62k ↓8.4k R120k W4.1k · at 2026-04-08 14:32:14
While a turn is running, the latest assistant note stays under the header as Markdown, up to three lines. Each visible call keeps its elapsed time right-aligned on the first row and may use one bounded continuation row. After it settles, notes hide and a muted receipt shows duration, tokens, cache, and local time. Collapsed failures are N failed only. Mid-turn steers stay on the same Run ledger: first lines pin under the header while it runs, then one ↳ N steers line remains. Ctrl+O expands the original timeline, with each ↳ in place, up to eight rows per call; failure details use an indented continuation row. The default flat timeline still shows one timed entry per call; set toolCalls.expandedTimeline to turns to group those entries under ↻ 1/3 · 3 calls headers with indented calls. Long bash scripts show intent and size instead of the body. Agent and consult use the same compact call rows. Image reads stay in the Run ledger like other output. Switch back with /tools individual.
User prompts always use the accent-gutter box.
Agent and consult
Both are aggregated by default. Agent rows show the agent type and task description, not the full prompt or control flags:
↗ Agent(Explore · Inspect ledger interactions) · dispatched
✓ Agent(Plan · Review the approach)
✓ consult(Review aggregate compatibility)
dispatched confirms a background invocation was accepted, not that the child task finished; its timing is the invocation time. Confirmed completed foreground calls use ✓, and queued/scheduled receipts remain distinct. Existing subagent widgets and /agents still provide live task views and history. Clicking a ledger row opens the ordinary Result / Args viewer; it does not open the subagent-specific viewer.
Visible custom messages, including subagent completion notifications, now fold into Run in their original transcript order. Expanding preserves their original renderer and native buttons. Notifications arriving after a final answer start a new segment rather than moving back to the dispatching run. Message-only segments show Run (N messages); messages do not count as tool calls. Hidden messages remain hidden, and widgets and UI-only custom entries stay separate. tools.passthrough controls tool calls, not these messages.
Explicit passthrough lists are preserved. These tools keep their native content, expansion and interactions, aligned with the ledger's content inset rather than the terminal's left edge. Set tools.passthrough to [] and /reload if an existing configuration still keeps Agent or consult outside the ledger.
Click to inspect
In Pi 0.85+ fullscreen mode, click anywhere in a collapsed Run block, including the receipt and current-call previews, to expand only that run. When expanded, the whole title/summary area can collapse it again. Top/bottom padding and expanded narration text do not toggle the ledger; dragging still selects text. Ctrl+O still switches the whole transcript and overrides local choices. Passthrough tools keep their native interactions.
Expanding a run keeps its aggregate title in view instead of following the newly expanded content to the bottom. When you scroll into a long expanded run and its title moves above the viewport, a right-aligned ↑ Run (…) · Collapse control appears at the top of the above-editor widget group. Click it to collapse only that run and return to its aggregate title. The control does not take keyboard focus or cover the transcript. These viewport controls require a compatible Pi 0.85+ fullscreen renderer; ordinary terminal-scrollback mode does not provide ledger mouse interaction.
Click an expanded tool-call row to open a read-only Result / Args viewer. Result formats JSON, Markdown files read from .md / .markdown / .mdx paths, and clear custom-tool Markdown; other source and logs remain literal. Args uses key/value rows and multiline blocks, with shell syntax colors for Bash commands. Extra Metadata lives behind ⋯ / M; it does not enter the primary Tab cycle. Raw / R shows source text or JSON. The popup does not redact credentials; terminal-control filtering and explicit size limits still apply, so check content before sharing it. Long text lines wrap automatically, including after resizing. Use Tab to switch Result/Args, arrows/Page Up/Page Down or the wheel to scroll, and Esc to return. Output already truncated by the tool cannot be recovered.
For successful Edit calls with returned diff data, Result is the diff, without a separate tab. Successful Write calls use the same view to show supplied content as additions, explicitly labeled as written content rather than an overwrite delta. Write always uses a single-column layout; Edit follows the global Diff layout and diff.splitMinWidth. Both retain the global Diff indicators and diff.wordWrap settings. Layout and indicator settings are also available in aggregate /tools. Raw retains the original return and source content; failures or missing required data show the ordinary result. Historical changes are never reconstructed from the current file.
In the ledger, Bash(command) is shown only when the complete target fits one display row. Longer or multiline commands show Bash, intent and size instead; click the expanded call to inspect the complete arguments.
Expanded steers wrap at the terminal width. Up to eight content rows stay visible; longer messages keep the first three and last two rows around … N lines hidden · click to view. Click that omission row to inspect the original message. Collapsed steers still occupy one line each.
Context growth
In aggregate, open /tools and turn Context growth on (default: off). The run receipt shows net growth; choose Expanded timeline → turns to see which steps contributed:
took 18s · ctx ≈+3.2k · tok ↑… ↓…
↻ 1/2 · 2 calls · ctx +2.4k
A subsequent completed request supplies the input difference, displayed on the preceding turn. The last/unconfirmed turn uses a local estimate marked ≈; any estimate also marks the run total. Ordinary replies without tool calls never get a context footer; their final usage still contributes to the run total. Tool-bearing passthrough turns may use a lightweight footer. flat shows only the run total. Switching this setting does not reload.
ctx measures context growth, not cumulative token consumption (tok) or individual tool costs. Reported differences may also reflect prompt/provider transformations. Missing data or known context boundaries such as steering, compaction, or model changes make the run total ctx n/a instead of a misleading number.
Settings
Open /tools or edit the example at config/config.example.json.
| What you change | Effect |
|---|---|
toolCalls.layout |
individual or aggregate |
toolCalls.expandedTimeline |
flat per-call Ctrl+O rows, or turns grouped by agent turn (aggregate only; no reload) |
toolCalls.showContextGrowth |
Show ctx run totals and turn badges; default false (aggregate only; no reload) |
results.mode |
compact, summary, or preview |
intent.language |
Bash intent language: best-effort request following, Simplified Chinese, or English (applies after /reload) |
diff.layout / diff.indicators |
Edit diff layout and shared Edit/Write markers; Write is always single-column |
diff.collapsedMode |
body preview, or summary stats only (individual tool rows) |
tools.passthrough |
Explicit tools that keep their original renderer; default [] |
Older toolCalls.style and transcript.userMessageStyle settings are ignored.
Custom tools
In aggregate mode, generic custom tools show at most two identifying values without key names, such as web_search(prod metrics) or todo(Review the migration). Prompts, payloads, control flags and credential-like values stay out of the inline preview; open Args for full key/value detail. A tool-provided getCallPresentation remains authoritative. Individual mode keeps its existing parameter preview.
Wrap the tool before pi.registerTool if you want the same intent field:
import {
  decorateToolForDisplay,
  withDisplaySummary,
} from "@zhcsyncer/pi-tool-display-intent/tool-display-api-consumer";
import { Type } from "typebox";

const tool = withDisplaySummary({
  name: "web_search",
  label: "Web Search",
  description: "Search the web.",
  parameters: Type.Object({
    query: Type.String()
  }),
  async execute(_toolCallId: string, args: { query: string }) {
    return runSearch(args.query);
  }
}, {
  language: "auto",
  required: true
});

pi.registerTool(decorateToolForDisplay(tool, {
  kind: "generic",
  outputMode: "inherit",
  overrideExistingRenderers: true
}));
License
MIT. See LICENSE and UPSTREAM_LICENSE.