pi-local-stats
Local usage statistics dashboard for the Earendil Pi coding agent
Package details
Install pi-local-stats from npm and Pi will load the resources declared by the package manifest.
$ pi install npm:pi-local-stats- Package
pi-local-stats- Version
0.0.4- Published
- Sep 9, 2026
- Downloads
- 636/mo · 370/wk
- Author
- tellyd
- License
- MIT
- Types
- extension
- Size
- 1.2 MB
- Dependencies
- 2 dependencies · 1 peer
Pi manifest JSON
{
  "extensions": [
    "./index.ts"
  ],
  "image": "https://raw.githubusercontent.com/TellyD/pi-local-stats/main/assets/dashboard.png"
}Security note
Pi packages can execute code and influence agent behavior. Review the source before installing third-party packages.
README
Pi Local Stats
A private, local dashboard for understanding your Pi usage.
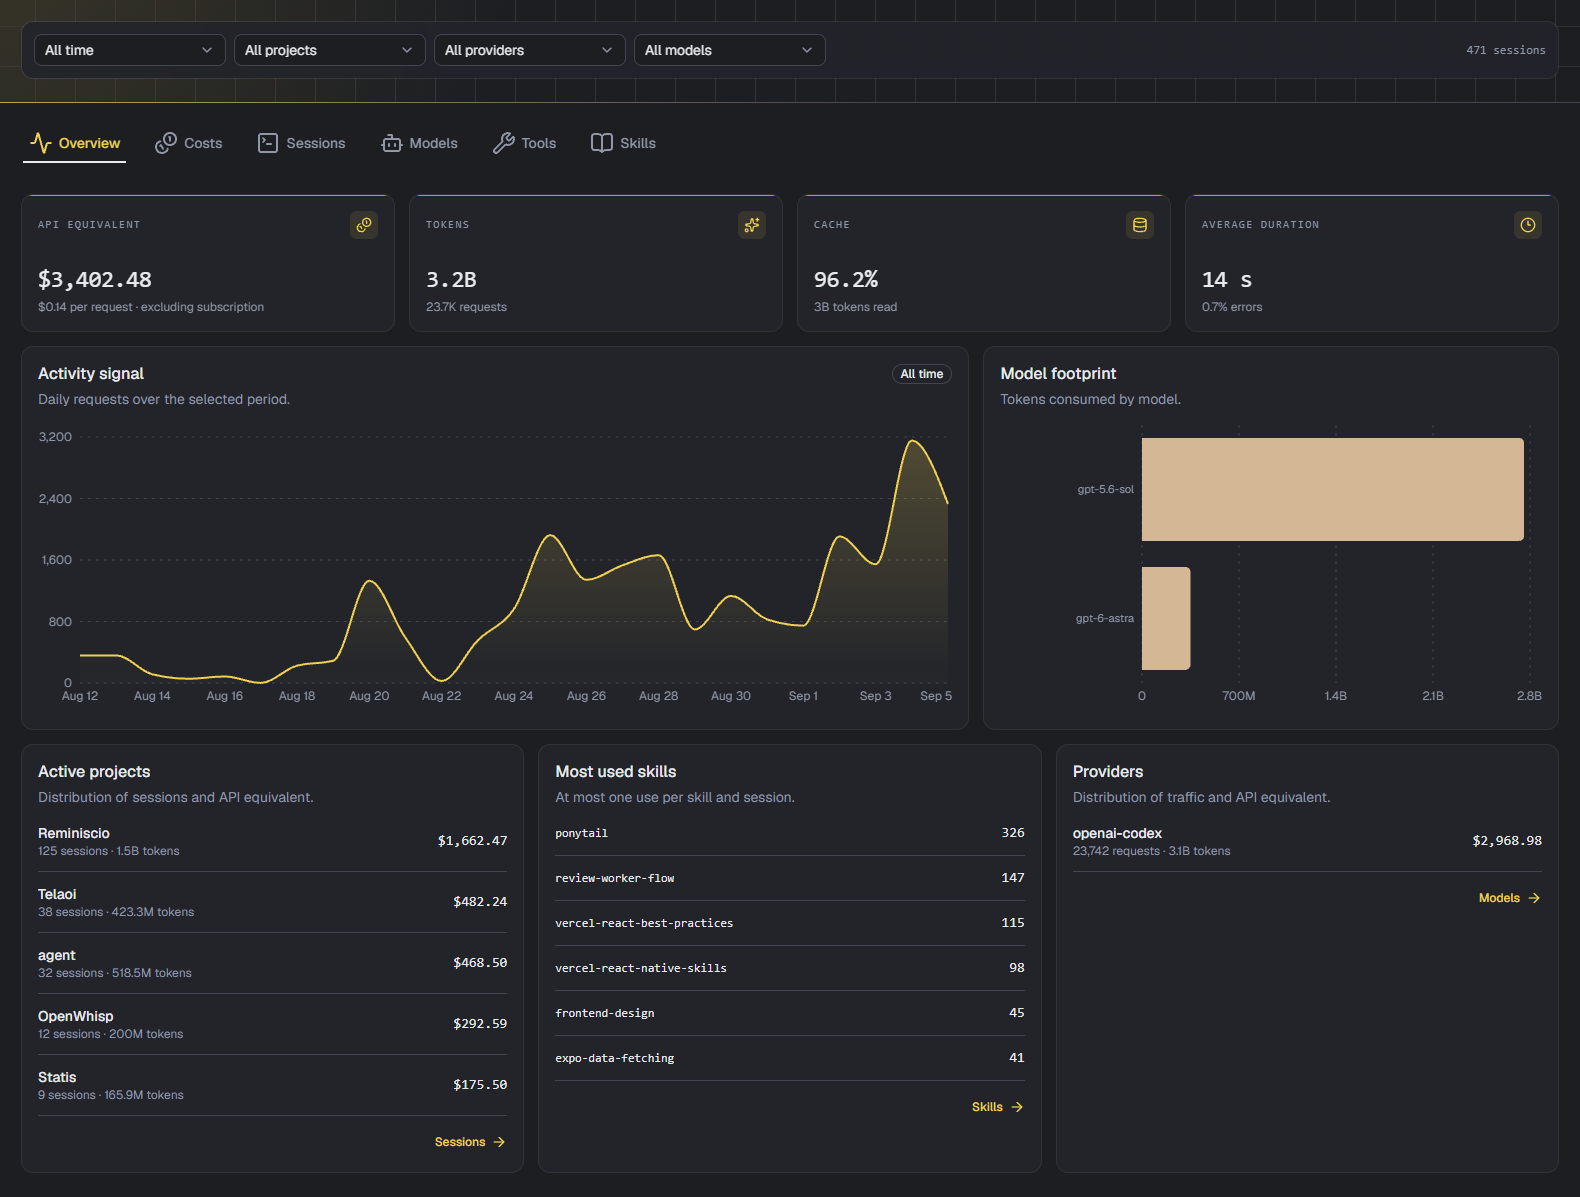
Run /stats from Pi to explore activity, token usage, API-equivalent costs, models, tools, and skills in your browser.
Requirements
- Pi 0.84.1 or newer
- Node.js 22 or newer
Linux is verified. macOS and Windows are expected to work but have not yet been tested.
Install
pi install npm:pi-local-stats
Then run /stats inside Pi.
Features
- Usage overview: requests, tokens, cache rate, errors, and average duration
- Daily activity and API-equivalent cost trends, including cost by session
- Normalized agent accounting for
pi-subagentsand@tintinweb/pi-subagents, with nested runs, provenance, and precision indicators - Breakdowns by project, provider, and model
- Tool usage, error rate, and average duration
- Skill usage detected from
readcalls targetingSKILL.md, deduplicated per session - Navigable pages with direct links and native browser back/forward support
- URL-backed filters, sorting, and session pagination
- Per-session timelines with expandable agent-type groups, token totals, overlapping runs, and inspectable events and costs
- Separate request, tool, and agent failure filters, compressed gaps, and mobile timeline scrolling
- Options to hide models or permanently delete their existing statistics history
- English and French interface
- Automatic background sync while the dashboard is open
Usage
Inside Pi, run:
/stats
The extension indexes your local session metadata, starts a server on 127.0.0.1, and opens the dashboard in your default browser. The server stops when the Pi session shuts down.
Use Sync to rescan sessions and supported agent artifacts immediately. Otherwise, the dashboard checks for changed files every 30 seconds while it is open.
The trash button on Models deletes a provider/model’s existing indexed usage across all periods, including hidden history. Deletion requires confirmation and leaves Pi session files unchanged. Deletion markers prevent old records from returning during sync; new detailed requests and new agent runs can appear again. Cumulative totals from affected existing agent runs (and overlapping ancestor totals) remain excluded, including later updates, because historical and new usage cannot always be separated. Keep the SQLite index to preserve these deletion markers.
Privacy
- Data stays on your machine.
- Full Pi conversation messages, model responses, tool inputs and results, and lifecycle error text are not stored in the statistics index.
- Session traces display only indexed timing, hierarchy, status, model, token, and cost metadata.
- The index stores session and agent IDs and names, project and artifact paths, timestamps, providers, models, tool and skill names, statuses, provenance, token usage, durations, error flags, and costs.
- Supported subagent metadata can include selected fields from orchestration tool calls and results, such as the agent type, model, name, and task description.
- The local API is protected by a random token and only listens on
127.0.0.1. - The SQLite index is stored at
~/.pi/agent/stats/stats.sqliteby default.
The dashboard reads usage metadata already present in Pi session files and supported agent lifecycle artifacts. Cost figures are API-equivalent estimates based on recorded usage and exclude subscription pricing. When sources overlap or an aggregate cannot be assigned safely, the dashboard prefers one authoritative source and marks the accounting partial instead of guessing or double-counting.
Development
Clone the source repository, then run the development commands:
git clone https://github.com/TellyD/pi-local-stats.git
cd pi-local-stats
npm ci
npm test
npm run typecheck
npm run lint
npm run build
pi -e ./index.ts
npm run format formats the TypeScript and TSX sources in place. For local
visual checks, install Chromium once with npx playwright install chromium,
then run npm run visual:capture; screenshots are written to visual-output/.
License
MIT. Bundled third-party software and font notices are listed in THIRD_PARTY_NOTICES.md.