pi-trace-extension
Langfuse-style trace viewer for pi-agent — local-first, zero-setup, single-file HTML
Package details
Install pi-trace-extension from npm and Pi will load the resources declared by the package manifest.
$ pi install npm:pi-trace-extension- Package
pi-trace-extension- Version
0.1.6- Published
- Jun 12, 2026
- Downloads
- not available
- Author
- niupian
- License
- MIT
- Types
- extension
- Size
- 2 MB
- Dependencies
- 0 dependencies · 1 peer
Pi manifest JSON
{
  "extensions": [
    "./extensions"
  ],
  "image": "https://raw.githubusercontent.com/npxcnency-ux/pi-trace-extension/main/examples/screenshot.png"
}
Security note
Pi packages can execute code and influence agent behavior. Review the source before installing third-party packages.
README
Experimental: Langfuse-style local trace viewer for pi-agent


pi-trace-extension reorganizes a pi-agent session from a conversation view into an execution view. pi's own session.jsonl is message-oriented — replayable, but flat. This extension subscribes to pi's lifecycle events and rebuilds them as a tree of how the agent actually progressed — every LLM call, every tool execution, every sub-agent, with timing, token cost, and outcome — written to disk as it happens.
Two artifacts are produced per session:
events.jsonl— machine-readable, append-only event streamtrace.html— a self-contained, single-file, Langfuse-style viewer (zero external assets, opens in any browser)
Everything stays on your machine.

pi's built-in session.jsonl |
pi-trace-extension |
|---|---|
| Conversation view (messages in order) | Execution view (steps + tools + sub-agents as a tree) |
One artifact (session.jsonl) |
Two artifacts: events.jsonl (machine) + trace.html (human) |
| Per-message metadata | Per-step latency, tokens, cost, stop reason, full LLM payload |
| Tool calls inline as messages | Tools as siblings of llm-generation inside a turn (Langfuse-style) |
| No status semantics | aborted / error / ok distinguished and color-coded |
| Sub-agent runs collapsed into a tool result | Sub-agent gets its own nested trace (turns / steps / tools) plus a click-through link from the parent |
中文文档见 README.zh.md
Install
# from npm (recommended)
pi install npm:pi-trace-extension

# or from GitHub
pi install git:github.com/npxcnency-ux/pi-trace-extension

# or try without installing (current pi run only)
pi -e npm:pi-trace-extension
You don't pick the install path. pi places it under ~/.pi/agent/npm/pi-trace-extension/ and auto-loads on every start. Coexists with any other pi extension.
Usage
Use pi normally — events are streamed to disk in the background.
~/.pi/agent/traces/<session-id>/events.jsonl
Render the HTML report at any time:
/trace
Output:
| File | Description |
|---|---|
~/.pi/agent/traces/<session-id>/trace.html |
Single-file viewer, opens in default browser |
~/.pi/agent/traces/<session-id>/events.jsonl |
Machine-readable event stream (append-only) |
~/.pi/agent/traces/<session-id>/subagents/<child-id>/ |
Nested directory per sub-agent — same events.jsonl + trace.html layout, linked from the parent's sub-agent node |
trace.html is also auto-generated on session_shutdown (without opening the browser), so closing pi normally always leaves a viewable report.
To re-render any past session manually:
python3 ~/.pi/agent/npm/pi-trace-extension/extensions/trace/trace_to_html.py [session-name]
# Omit the argument to pick the most recent session
The pipeline
pi runtime
  │  emits lifecycle events:
  │    session_start / interaction_start / turn_start
  │    before_provider_request  (full payload: model + messages + tools schema)
  │    message_end
  │    tool_execution_start / tool_execution_end
  ▼
extensions/trace/index.ts
  │  capture, sanitize (mask secret-like keys), truncate (8 KB/string)
  └─ writes JSONL → ~/.pi/agent/traces/<session-id>/events.jsonl
                                          │
   /trace command  (or session_shutdown)  │
  ────────────────────────────────────────┘
  │  spawn python3 extensions/trace/trace_to_html.py
  │    reads events.jsonl
  │    rebuilds the tree:
  │      session → interaction → turn → llm-generation + tool
  │      sub-agent results carry a child-trace link;
  │      a sub-agent's own events.jsonl is rendered into its own trace.html
  │    bundles viewer/assets.json (css + js + html) into one file
  └─ writes trace.html  → opens in browser
The data model is intentionally similar to Langfuse so the mental model carries over if you later upgrade to a hosted backend.
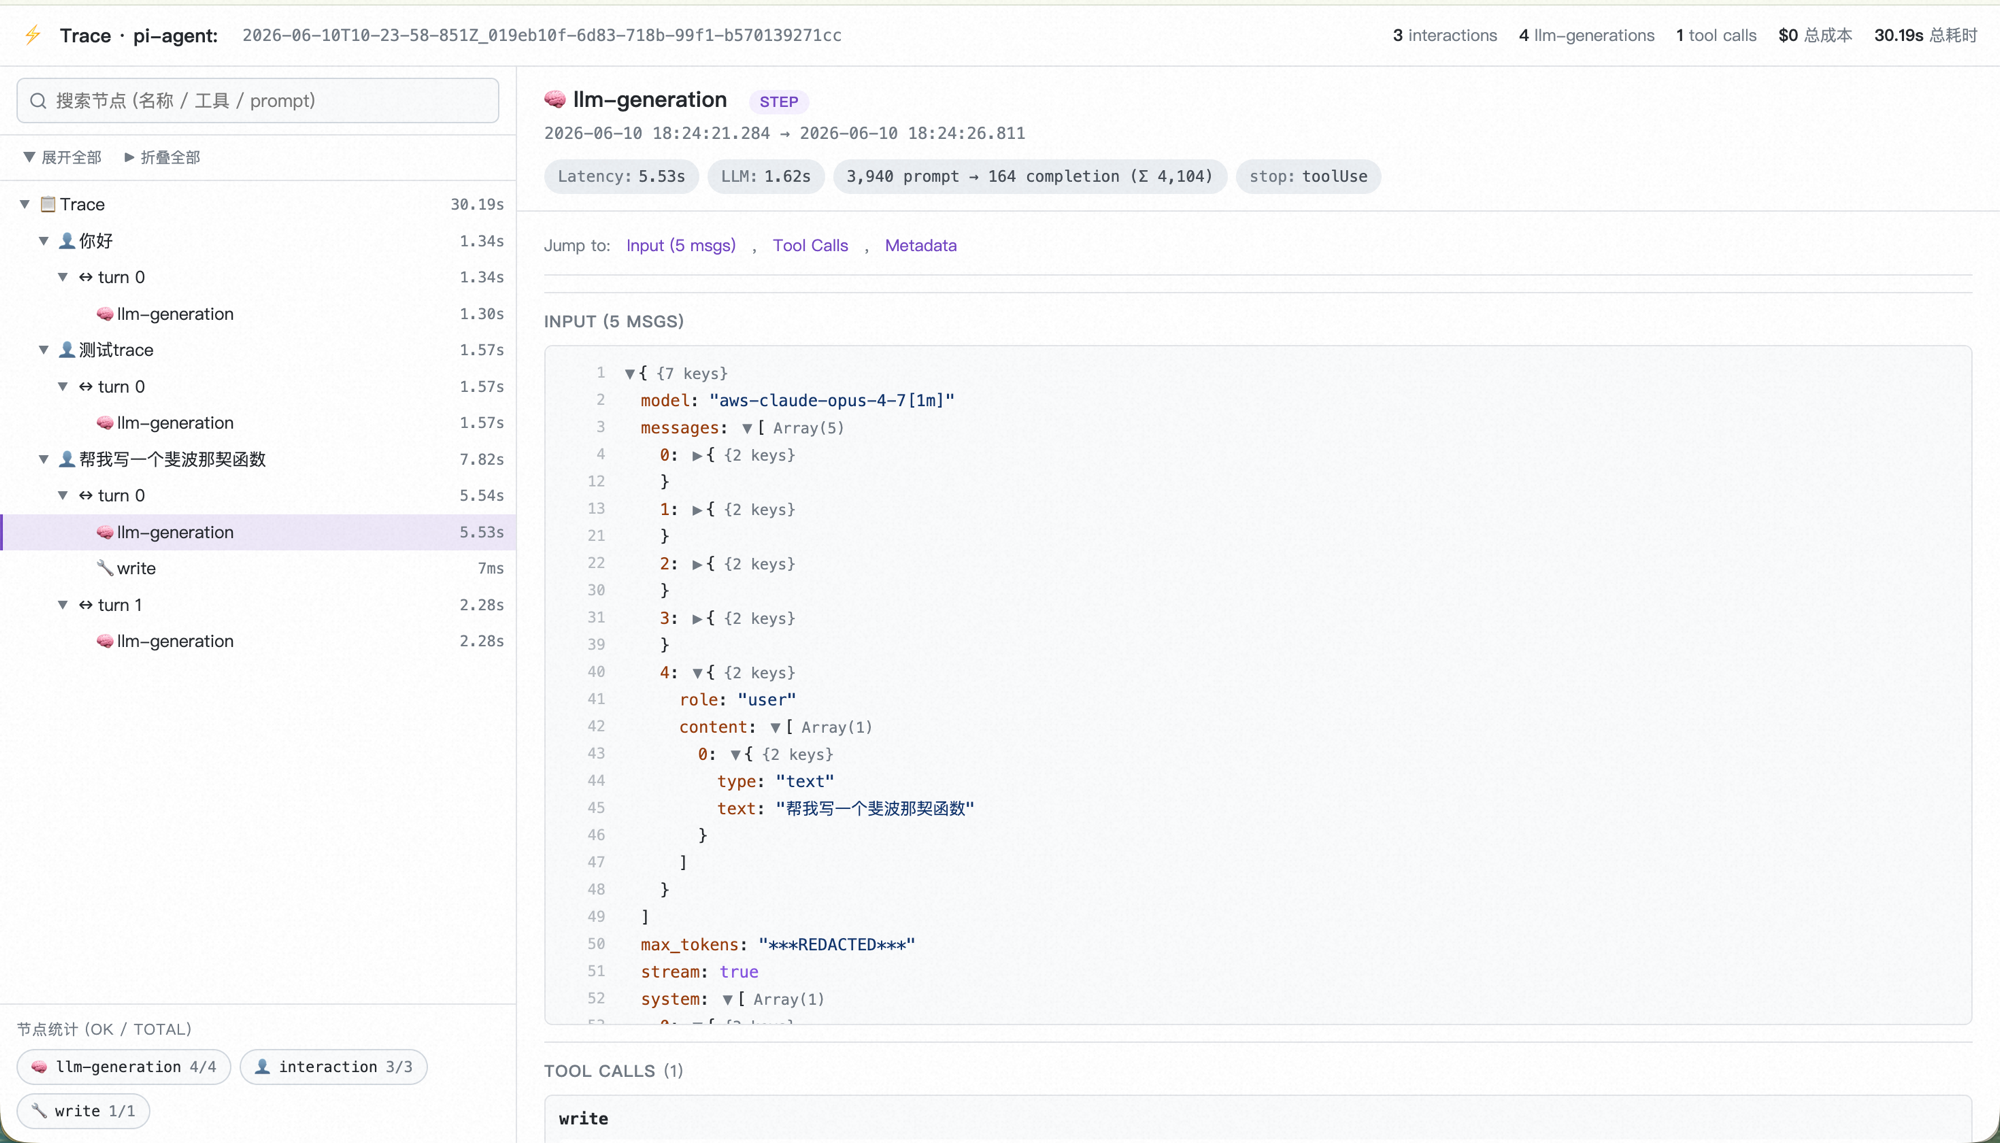
What you see in trace.html
A three-pane Langfuse-style viewer. Single HTML file, no CDN, no fonts loaded from the network, no analytics.
| Pane | Content |
|---|---|
| Top bar | Session id (click to copy), counts (interactions / generations / tool calls), total cost & duration |
| Left tree | Hierarchy: session → interaction → turn → llm-generation + tool (siblings inside a turn). Click any node to inspect. Search box filters by name / tool / prompt. |
| Right detail | For the selected node: badges (latency / token in→out / cost / model / stop reason), then sections — Input (full LLM payload as a foldable JSON tree with line numbers), Output, Tool Calls, Error / Aborted (color-coded), Metadata. |
| Bottom-left DAG stats | Per-tool counts in ok/total · N ⏹ form (bash 76/80 · 3 ⏹). Red border for errors, yellow for aborts. |
Specific affordances:
abortedvserrorvsok— distinguishes user-cancelled (⏹yellow) from real errors (❌red). 429 retries that eventually succeed are correctly classified asok.- Sub-agent has its own trace — when an agent spawns a sub-agent (single / parallel / chain), the child writes its own
events.jsonlundersubagents/<child-id>/and gets its own renderedtrace.html. The parent's sub-agent-result node shows the child's turns / steps / tools inline (rebuilt from messages) and offers an "Open child trace" button to jump into the child's full report. Parallel sub-agents are matched to their on-disk traces by sessionId where available. - Auto-retry detection — when a turn re-enters with the same
turnIndex(e.g. framework retried after a 429), the second occurrence is labeledturn N (retry #1)instead of collapsing the two into one node. - Full LLM input payload —
model, everymessages[]entry (includingreasoning_content,tool_calls,tool_result), the registeredtools[]schema, and request-level params (max_tokens, temperature, etc.). Long strings are truncated to 8 KB; the truncated length is shown. - Cross-process resilience — if you reload pi or fork a session, repeated
stepIndex/turnIndexvalues are correctly disambiguated via an internalepochcounter.
When to use this
Good fit:
- Regular pi-agent users who want to see what the LLM actually saw and what it actually did — step by step
- Debugging prompts, tool definitions, sub-agent orchestration, or long-session context compaction
- Environments where trace data must stay local (personal machine, no SaaS allowed)
- Looking at per-turn token usage / cost / cache hit-rate without paying for a hosted dashboard
Not a good fit:
- Production monitoring with alerting, multi-tenant aggregation, or long-term retention — pick Langfuse / LangSmith / Phoenix self-hosted
- Shared team dashboards — this is single-user, single-machine
- Tracing pipelines that don't run on pi-agent — this only consumes pi's event stream
What it doesn't do
Three categories — separated because they imply different mitigations.
By design (explicit choices, not failures)
- No network code. Not anonymized usage, not crash reports, not telemetry "to improve the product." If you want one of those, fork it.
- No automatic prompt scrubbing. Only key-name redaction (
password,token,secret,api_key,authorization,bearer→***REDACTED***) is applied at write time. Your raw prompts, tool args, tool outputs, and model responses are stored verbatim. - No team sharing UI. This is single-user, single-machine. If you outgrow that, Langfuse self-hosted is the natural next step — the data model is intentionally similar.
- No built-in retention/rotation.
events.jsonlgrows monotonically per session. Long sessions can reach tens of MB; renderedtrace.htmlmay be slow above 5 MB.
Structural (won't be fixed by better code)
/tracerequires Python 3.8+. The renderer is a Python stdlib script, intentionally — no Node-side rebuild step, no bundler. If you can't have Python, this isn't for you.- Tied to pi's event stream. A different agent framework would need its own capture layer.
Privacy ceiling
- Trace data is sensitive by default. Prompts, tool args, and model outputs may all contain PII / secrets that don't match the redaction regex. If you intend to share a
trace.html, review it manually first.
Comparison with hosted alternatives
This extension covers a smaller scope than the established players. Honestly:
| pi-trace-extension | Langfuse Cloud | LangSmith | Arize Phoenix | |
|---|---|---|---|---|
| Hosting | Local file | SaaS or self-hosted | SaaS only | SaaS or local notebook |
| Data leaves your machine | No | Yes | Yes | Configurable |
| Account required | No | Yes | Yes | Optional (cloud) |
| Cost | Free, MIT | Free tier + paid | Paid | Free OSS |
| Multi-user dashboard | No | Yes | Yes | Yes |
| Alerting / SLO | No | Yes (paid) | Yes | Yes |
| Cross-session aggregation | No | Yes | Yes | Yes |
| pi-agent native | Yes | Adapter possible | No | Adapter possible |
| Time to first chart | Seconds | Minutes (sign-up) | Minutes | Minutes |
They are not competitors — they solve different problems.
Requirements
- pi-agent ≥ 0.79.x
- Node ≥ 18 (extension runtime)
- Python ≥ 3.8 (renderer; override with
PI_TRACE_PYTHON=/path/to/python3if needed)
No other dependencies. Renderer uses Python stdlib only; viewer uses no JS framework.
File structure
pi-trace-extension/
├── README.md / README.zh.md / LICENSE / package.json
├── examples/
│   └── screenshot.png
└── extensions/
    └── trace/
        ├── index.ts            # pi extension entry (event capture, /trace command)
        ├── trace_to_html.py    # renderer (events.jsonl → trace.html)
        └── viewer/
            ├── assets.json     # bundled css + js + html (runtime-loaded, committed)
            ├── viewer.css      # source
            ├── viewer.html     # source
            ├── viewer.js       # source
            └── build.py        # rebuild assets.json after editing the sources
FAQ & Troubleshooting
Two [pi-trace] extension loaded lines on startup. Another version of the extension is also being loaded (e.g. you previously copied it into ~/.pi/agent/extensions/trace/). Move the older one out of ~/.pi/agent/extensions/ — pi auto-loads any */index.ts under that directory.
/trace reports python3: command not found. Either install Python 3.8+, or set PI_TRACE_PYTHON to your interpreter:
export PI_TRACE_PYTHON=/opt/homebrew/bin/python3
Browser doesn't open automatically. The path is shown in the notification — open it manually. Underlying commands tried: open (macOS), xdg-open (Linux), start (Windows).
events.jsonl is huge / trace.html is slow. Long strings are truncated to 8 KB per field, but a deep multi-day session can still grow. There's no auto-rotation yet — start a new session if needed.
Want to share a trace but it has sensitive content. No built-in scrubber beyond the key-name regex. Open trace.html, search for the sensitive substring, edit by hand, then share. A CLI scrubber is on the roadmap.
Development
git clone https://github.com/npxcnency-ux/pi-trace-extension
cd pi-trace-extension
pi -e .   # try locally
Edit viewer style/behavior:
extensions/trace/viewer/viewer.css— stylesextensions/trace/viewer/viewer.js— viewer logicextensions/trace/viewer/viewer.html— HTML shell
Then rebuild the bundled JSON (this is what end-users load):
python3 extensions/trace/viewer/build.py
Edit the data pipeline: extensions/trace/index.ts (event capture) or extensions/trace/trace_to_html.py (event → tree → HTML). Both are reload-friendly: pi /reload re-runs the extension; python3 trace_to_html.py is one-shot.
PR bar:
- New event types must degrade gracefully on existing renderers (additive only)
- No new runtime dependencies (Python stdlib + Node built-ins)
- Privacy regressions get rejected — any new network call must be opt-in and documented
Roadmap
- CLI scrubber:
python3 trace_to_html.py <session> --redact-prompts - Multi-session index page (
~/.pi/agent/traces/index.html) - Optional OTLP exporter (opt-in env var) for forwarding to Langfuse / Phoenix self-hosted
- Auto-rotation when
events.jsonlexceeds N MB
License
Acknowledgements
The viewer's three-pane layout, color palette, and node-detail structure are heavily inspired by Langfuse's trace explorer. This project has no affiliation with Langfuse — they're an excellent product and the natural next step if you outgrow this.
pi-agent is built by the team at pi.dev.